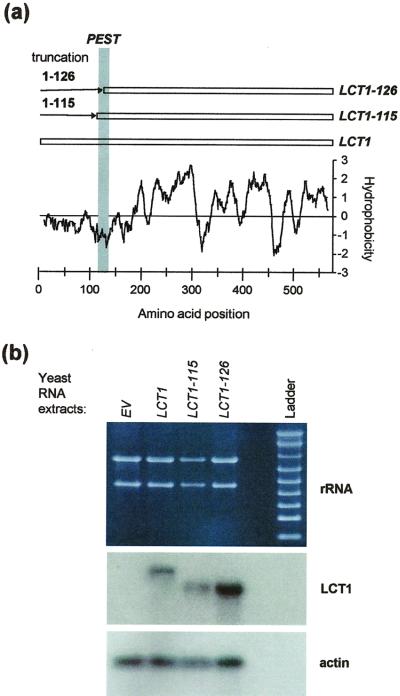
Figure 6.
Construction of N terminally truncated LCT1 genes and expression in yeast. a, Positions of PEST sequence and N-terminal truncations on the hydropathy plot of LCT1. b, Agarose-formamide gel and northern blots of total RNA extracted from G19 cells transformed with EV (first lane), full length LCT1 (second lane), and N-terminal truncations LCT1-115 (third lane), and LCT1-126 (fourth lane). Top, Bands for ribosomal RNA on agarose-formaldehyde gel. Middle, Hybridization of blot with LCT1 probe. Bottom, Hybridization with actin probe. Note that differences in band intensities for LCT1 constructs are mainly due to different loading.

