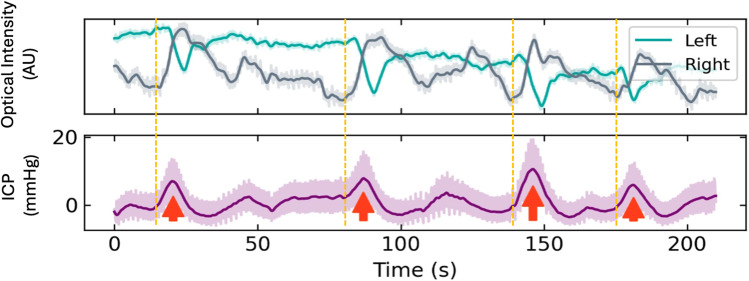
Figure 5.
Lundberg B waves. The Optical Intensity (660 nm) demonstrates slow waves over the left and right hemispheres associated with Lundberg B waves present in the invasive intra-cranial pressure (ICP) signal. The right sided changes are a little earlier than the left suggesting increased cerebral blood flow on the that side.
Notes: Adapted from Teo EJ, Petautschnig S, Hellerstedt J, et al. Cerebrovascular Responses in a Patient with Lundberg B Waves Following Subarachnoid Haemorrhage Assessed with a Novel Non-Invasive Brain Pulse Monitor: A Case Report. Med Devices (Auckl). 2024;17:73–87.31

