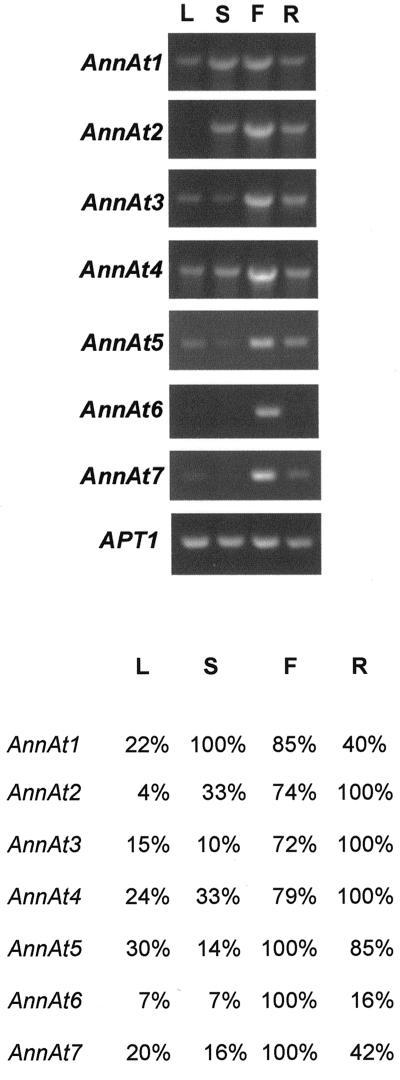
Figure 3.
RT-PCR analysis of the expression profiles of seven Arabidopsis annexins. Total RNA (2 μg) from leaf (L), stem (S), flower (F), and root (R) tissue was used to synthesize cDNA. A fraction (1/30) of the synthesized cDNA was used to amplify and quantitate AnnAt1–7 (accession nos. AF083913, AF083914, AF1888362, AF188363, AY014797, AY014798, and AY014799, respectively) gene transcripts. The sizes of the annexin PCR products are 954; 954; 966; 960; 951; 1,003; and 1,005 bp, respectively. The RT-PCR product of the APT1 gene (accession no. Y07681; 478 bp) was used as an internal control. A, Ethidium bromide-stained RT-PCR products separated in 1% (w/v) agarose gel. B, A chart depicting the relative amount of each annexin gene transcript. Optical densitometry was performed for each PCR product and normalized against the optical density obtained for the APT1 gene transcript for each tissue type. For each gene transcript, the tissue with the highest normalized optical density was designated 100% and the normalized optical densities for the remaining three tissues were expressed as a percentage.

