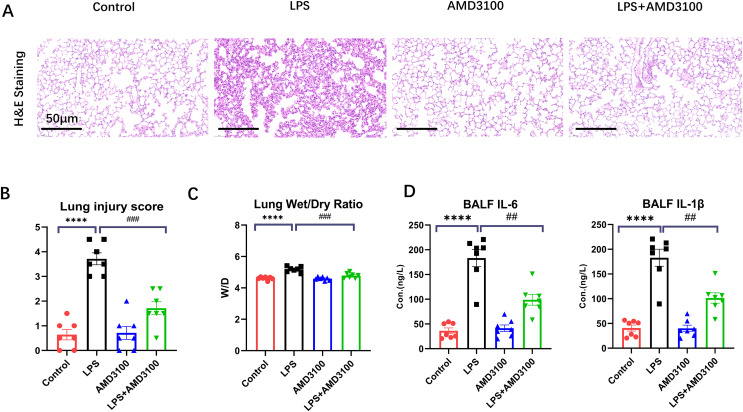
Figure 1. AMD3100 alleviated LPS-induced ALI in mice.
(A) Pathological images of control, LPS, AMD3100, and LPS + AMD3100 group. (B) Lung injury scores of the different groups. (C) Lung wet/dry ratio of the different groups. (D) The concentration of IL-6 and IL1-β in BALF. The data are expressed as mean ± SEM (n = 7 in each group). ****p < 0.0001 compared to control group. ##p < 0.01, ###p < 0.001, compared with the LPS group. ALI, acute lung injury; LPS, lipopolysaccharide; SEM, standard error of the mean; H&E, hematoxylin and eosin staining.

