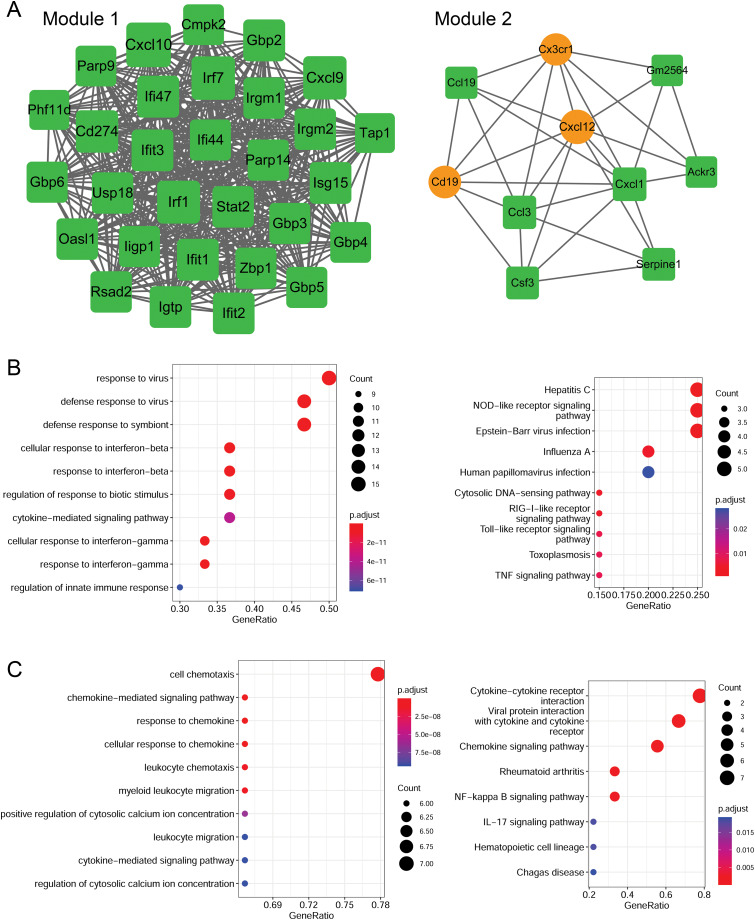
Figure 6. Identification of PPI modules and functional enrichment results of module genes.
(A) PPI modules. (B) GO and KEGG enrichment results for module 1. (C) GO and KEGG enrichment results for module 2. Yellow circle nodes indicate upregulated proteins between the LPS + AMD3100 and LPS groups, and green squares represent downregulated proteins between the LPS + AMD3100 and LPS groups. The size of the node depends on its degree. The higher the degree value, the larger the node. PPI, protein-protein interaction; LPS, lipopolysaccharide; GO, Gene Ontology; KEGG, Kyoto Encyclopaedia of Genes and Genomes.

