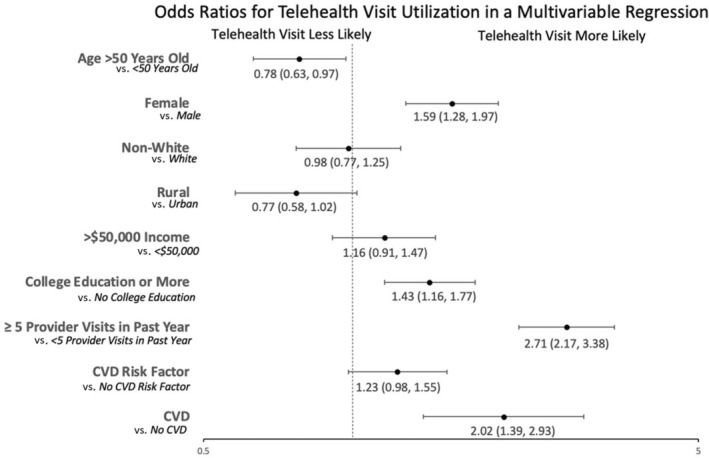
Figure 1. Multivariable analysis of telehealth visit (video or audio‐only) use in all respondents.

Odds ratios and corresponding 95% CIs for individual variables incorporated into a multivariable logistic regression of telehealth use in all participants are reported in a forest plot. The x axis of the plot is reported on a log scale. Variables with statistically significant odds ratios included cardiovascular disease (CVD), college education, female sex, and >5 visits in a year (denoting seeing a provider >5 times in a year).
