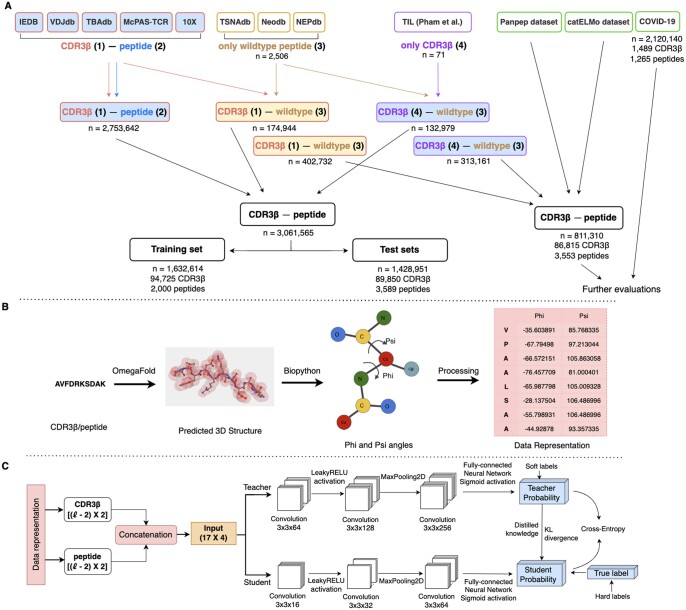
Figure 1.
Overview of epiTCR-KDA. (A) Diagram illustrating data collection for training and evaluation of epiTCR-KDA. Five public databases [IEDB (Vita et al. 2019), VDJdb (Shugay et al. 2018), TBAdb (Zhang et al. 2020), McPAS-TCR (Tickotsky et al. 2017), and 10X (A New Way of Exploring Immunity—Linking Highly Multiplexed Antigen Recognition to Immune Repertoire and Phenotype | Technology Networks, 2020)] were collected for TCR-peptide pairs, with publicly collected TCR labeled as (1) and publicly collected peptides labeled as (2) (Supplementary Table S1). Three databases [TSNAdb ( Wu et al. 2023a), Neodb (Wu et al. 2023b), and NEPdb (Xia et al. 2021)] were gathered for self-peptides (wildtype peptides), labeled as (3). These peptides were randomly combined with TIL TCR, labeled as (4), from public TCR-peptide pairs to form non-binding pairs [i.e. (3) combined with (4)]. Additionally, non-binding pairs were also generated from TIL CDR3β sequences with public wildtype peptides [i.e. (1) combined with (3)]. The data were divided into training data (Supplementary Fig. S2), and testing data covering various data sources, seen and unseen peptides (Supplementary Table S2). (B) Data preprocessing steps starting from the conversion of CDR3β/peptide amino acid sequences to 3D structures using OmegaFold, followed by the calculation of the phi and psi angles, and processing this information as input for the model (Supplementary Fig. S1). (C) Structure of the KD model. The CDR3β and peptide representation (phi and psi angles) were concatenated, padded, and served as input for the KD model. The KD model involved a student model learning from the information provided by the teacher model (soft loss) and ground-truth labels (hard loss). The model was trained to predict the binding or non-binding of CDR3β-peptide pairs.

