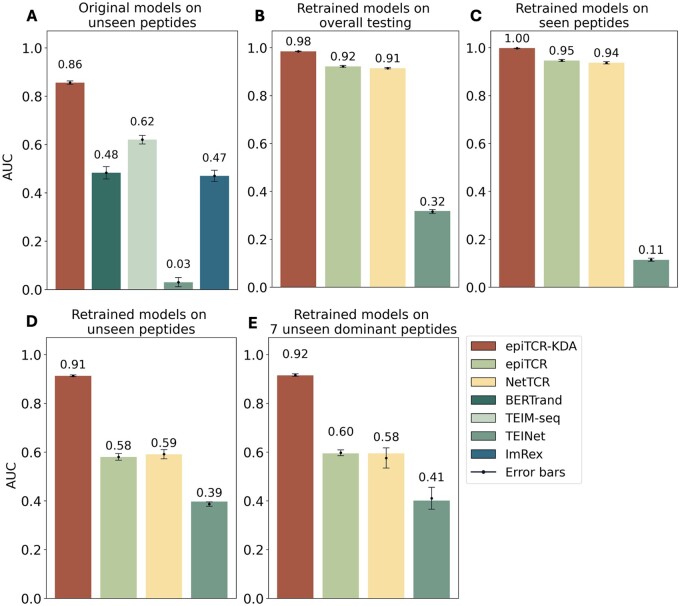
Figure 2.
The performance of epiTCR-KDA, epiTCR, NetTCR, BERTrand, TEIM-Seq, TEINet, and ImRex across different benchmark settings: (A) original models tested on 10 datasets containing peptides unseen from training of all those models, (B) retrained models on 10 overall testing sets including both seen and unseen data, (C) retrained models on data derived from seen peptides, (D) retrained models on data derived from seen peptides, and (E) retrained models on data derived from 7 dominant unseen peptides (Supplementary Table S7). The performance was measured by AUC. Each bar indicates the mean performance from ten testing sets and the error bar indicates the standard deviation. The original models of epiTCR and NetTCR were also benchmarked on interactions of unseen peptides; however, epiTCR produced only positive predictions, while NetTCR gave only negative predictions for all interactions. Consequently, AUC was not calculated for epiTCR and NetTCR in this testing scenario (Supplementary Table S5).

