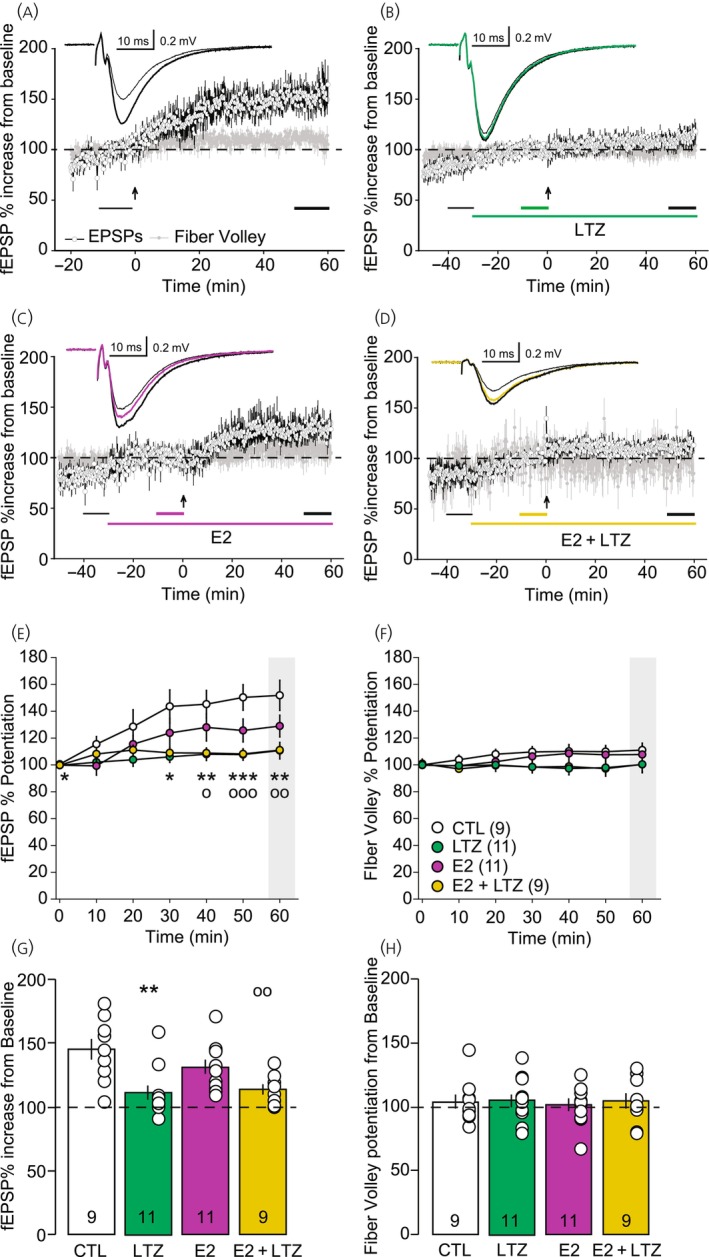
FIGURE 4.

Time course and analysis of long‐term potentiation (LTP) of Schaffer collateral to CA1 synapse in the hippocampus. (A) Time course of slope of field excitatory postsynaptic potential (fEPSP) (open circles) and fiber volley (gray circles) in control condition (CTL, n = 9), in absence of any treatment sampled every 10 s; insert: Average traces 10 min before (thin gray trace) and 50 min after theta burst stimulation (TBS, black trace). (B) Time course of slope of fEPSP (open circles) and fiber volley (gray circles) in presence of letrozole (LTZ) (100 nM, n = 11) sampled every 10 s; insert: Average traces 10 min before LTZ application (thin black trace), 20 min after LTZ application (green trace) and 50 min after TBS (thick black trace). (C) Time course of slope of fEPSP (open circles) and fiber volley (gray circles) in presence of 17‐β‐estradiol (E2) (10 nM, n = 11) sampled every 10 s; insert: Average traces 10 min before E2 application (thin black trace), 20 min after LTZ application (purple trace) and 50 min after TBS (thick black trace). (D) Time course of fEPSP (open circles) and fiber volley (gray circles) in presence of E2 (1 nM) and LTZ (100 nM) sampled every 10 s (n = 9); insert: Average traces 10 min before E2 application (thin black trace), 20 min after drug application (yellow trace) and 50 min after TBS (thick black trace). In (A)–(D), the long‐colored line indicates when the drugs are applied; the arrow indicates the time at which the TBS was applied; the two or three short bottom lines indicate the periods over which the traces represented in the insert were averaged as well as the averaged values used in (G) and (H). (E) Development of the fEPSP after the LTP induction represented in 10‐min bin. Interaction: F(18,216) = 2.784, p < .004; Time: F(6,216) = 15.932, p < .001; Group: F(3,36) = 5.623, p = .003. (F) Development of the fiber volley after the LTP induction represented in 10 min bin. Interaction: F(18,216) = .955, p = .514; Time: F(6,216) = 1.788, p = .103; Group: F(3,36) = 1.529, p = .224. In (E) and (F), the time 0 min corresponds to the baseline before TBS to which the values have been normalized. (G) Bar graph representation of the last 10 min of fEPSP recordings relative to baseline (indicated by the short black line in A). F(3,39) = 6.527, F(3,39) = 6.527. (H) Bar graph representation of the last 10 min of fiber volley recordings relative to baseline (indicated by the short black line in C). F(3,39) = 0.078, p = .971. Post hoc statistics for (E) and (G): *p < .05, **p < .01, ***p < .001 CTL versus LTZ and ○p < .05, ○○p < .01, ○○○p < .001, CTL versus E2 + LTZ.
