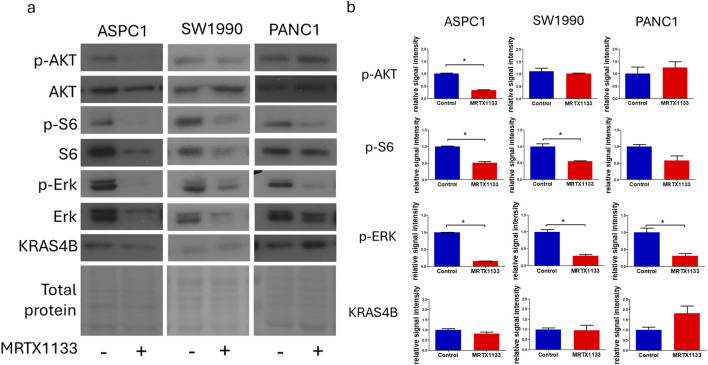
FIGURE 2.
Changes in cell signaling after MRTX1133 treatment. Cells were treated with 100 nM MRTX1133 for 48 h. RAS-related cell signaling was determined by Western blotting. (A) Representative bands of the proteins investigated. Activated, phosphorylated proteins are marked with the “p-” prefix. (B) Densitometric evaluation of the activation or expression of the represented proteins. Data were normalized to total protein level and expressed relative to control using GraphPad Prism 5 software (±SEM). Data are derived from three independent experiments. Asterisks mark significant differences (p < 0.05) as determined by an unpaired t-test.

