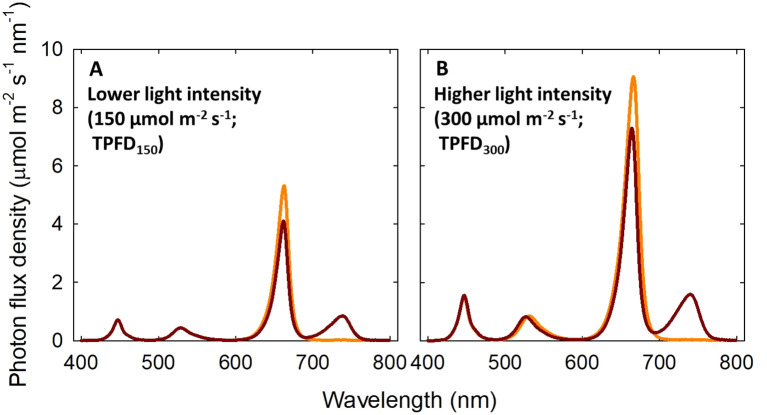
Figure 1.
Spectral distributions of four light treatments consisted of blue (B; 400-500 nm), green (G; 500-600 nm), red (R; 600-700 nm), and far-red (FR; 700-800 nm) photons delivered by light-emitting diodes. Two total photon flux densities (TPFD; 400 to 800 nm) were used: μmol m-2 s-1 (A) and 300 μmol m-2 s-1 (B). Two light spectral treatments were denoted based on the percentage of FR photons in TPFD: 0%FR (B15G15R120) and 20%FR (B15G15R90FR30) under TPFD of 150 μmol m-2 s-1 and 0%FR (B30G30R240) and 20%FR (B30G30R180FR60) under TPFD of 300 μmol m-2 s-1. The subscript after each waveband indicates its photon flux density in μmol m-2 s-1.

