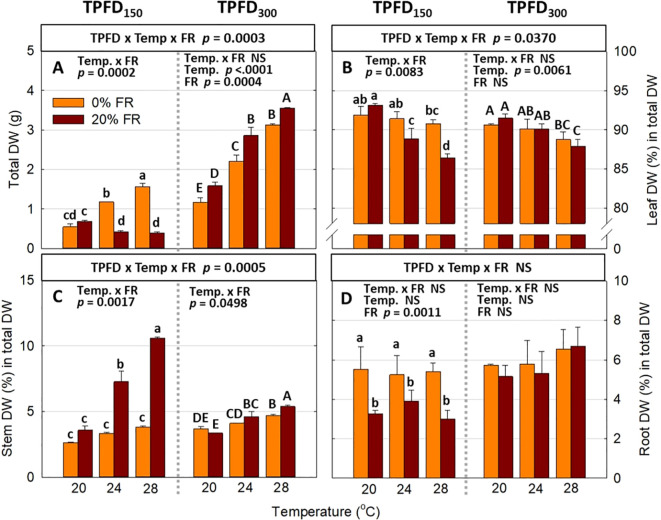
Figure 6.
The interactive effect between light spectra and temperature under two light intensities [150 and 300 μmol m-2 s-1 in total photon flux density (TPFD; 400-800 nm)] on total dry weight (DW) (A), leaf DW (%) in total DW (B), stem DW (%) in total DW (C), and root DW (%) in total DW (D). The two light spectra are denoted based on the percentage of far-red photons (FR; 700-800 nm) in TPFD, i.e., 0 and 20% FR light. The three temperatures were 20, 24, and 28°C. Different letters following the mean ± SE [n = 2; subsamples (4 plants per treatment per replicate study) were averaged before statistical analysis] indicate significant difference among the six treatments (three temperatures x two FR levels) at each light intensity at p< 0.05. NS stands for non-significance.

