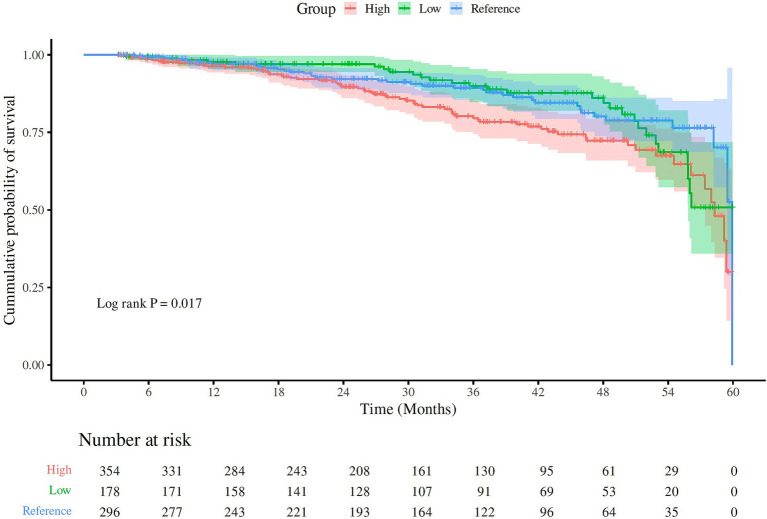
Figure 2.
The Kaplan–Meier curves for all-cause mortality in the different UA groups. The different UA groups were classified as low (<5.0 mg/dL), reference (5–7 mg/dL), and high (>7.0 mg/dL). The patients in the high UA group, followed by the patients in the low UA group, had higher all-cause mortality compared to the patients in the reference UA group (log-rank χ2 = 4.8; p = 0.017).

