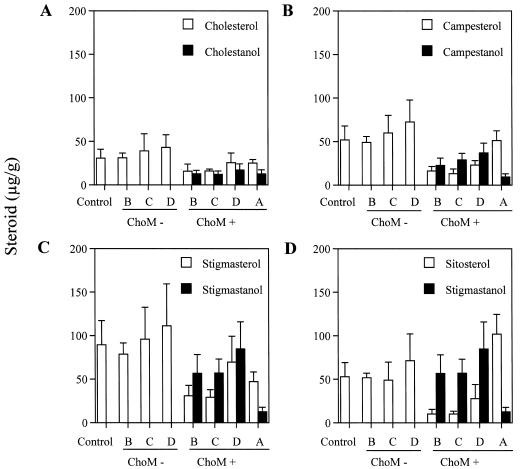
Figure 7.
Individual sterol and stanol contents of transgenic and control tobacco lines. All data is represented as average micrograms of steroid per gram fresh weight with calculated ses of the mean. A, Total cholesterol and cholestanol levels for control and groups A, B, C, and D. B, Total campesterol and campestanol levels for control and groups A, B, C, and D. C, Total stigmasterol and stigmastanol levels for control and groups A, B, C, and D. D, Total sitosterol levels compared to stigmastanol for control and groups A, B, C, and D. The complete reduction of sitosterol and stigmasterol produce stigmastanol; therefore, stigmastanol will be used in comparison to both sterols. Group A plants express the nontargeted choM gene from pMON33813. Group B, C, and D ChoM+ represent R1 transgenic plant lines which express chloroplast-targeted choM gene from pMON33814. Group B, C, and D ChoM- represent segregating R1 transgenic plant lines derived from R0 plants transformed using pMON33814, but that do not express ChoM. Control represents nontransformed tobacco of the same developmental age as the experimental lines.

