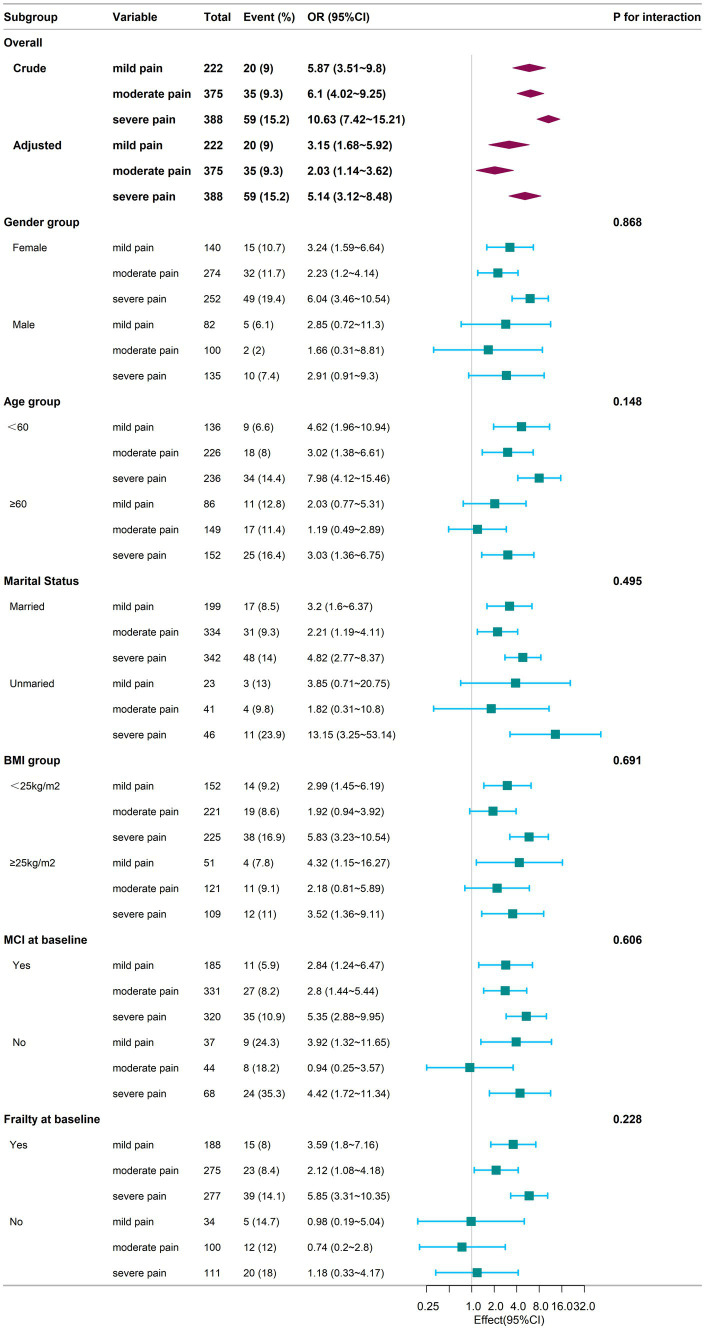
Figure 3.
Subgroup analysis of the association between chronic pain and cognitive frailty during the follow-up period. Adjustments for confounding variables were performed using Model 4. The sample for the subgroup logistic regression analysis mirrors that of the overall logistic regression conducted during the follow-up phase. The baseline frailty and mild cognitive impairment (MCI) subgroup excludes individuals diagnosed with cognitive frailty at baseline, as these subjects were not included during the follow-up due to subsequent exclusion criteria. Square symbols represent the odds ratios (ORs), and horizontal lines indicate the 95% confidence intervals (CIs). Diamond shapes depict the population-level odds ratios, with the points along the edges of the diamonds representing the 95% confidence intervals. CI, Confidence Interval; OR, Odds Ratio; BMI, Body Mass Index; MCI, Mild Cognitive Impairment.

