FIGURE 3.

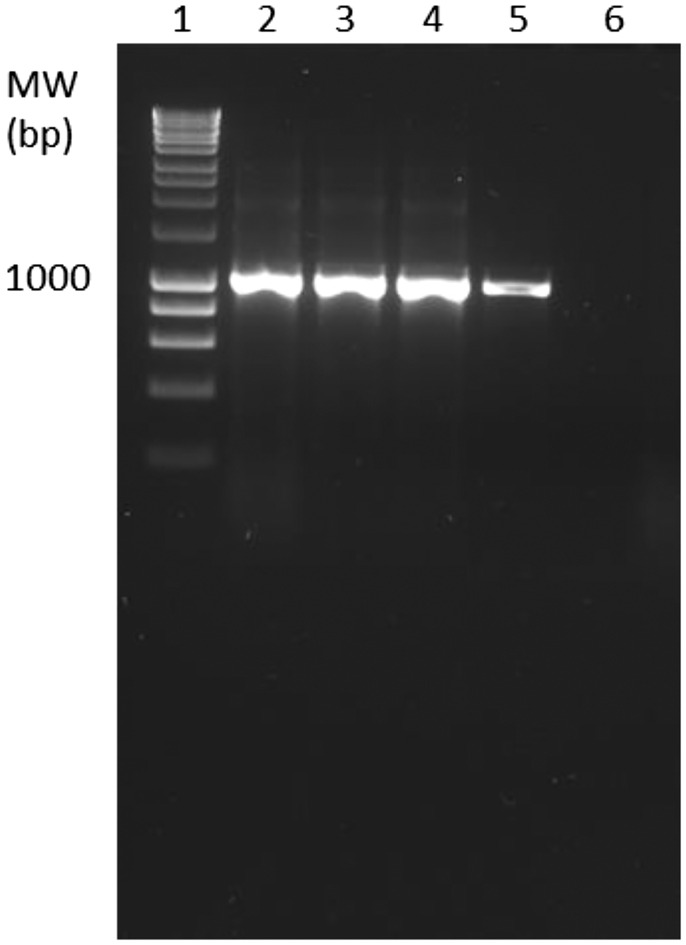
PCR amplification of samples visualized on a 1.5% (w/v) agarose gel. Gel lanes: 1. 1 kb Hyperladder, 2. Handfish 1 (H1), 3. Handfish 2 (H2), 4. Handfish 3 (H3), 5. Positive Control (U02), 6. Negative Control (no template control).

PCR amplification of samples visualized on a 1.5% (w/v) agarose gel. Gel lanes: 1. 1 kb Hyperladder, 2. Handfish 1 (H1), 3. Handfish 2 (H2), 4. Handfish 3 (H3), 5. Positive Control (U02), 6. Negative Control (no template control).