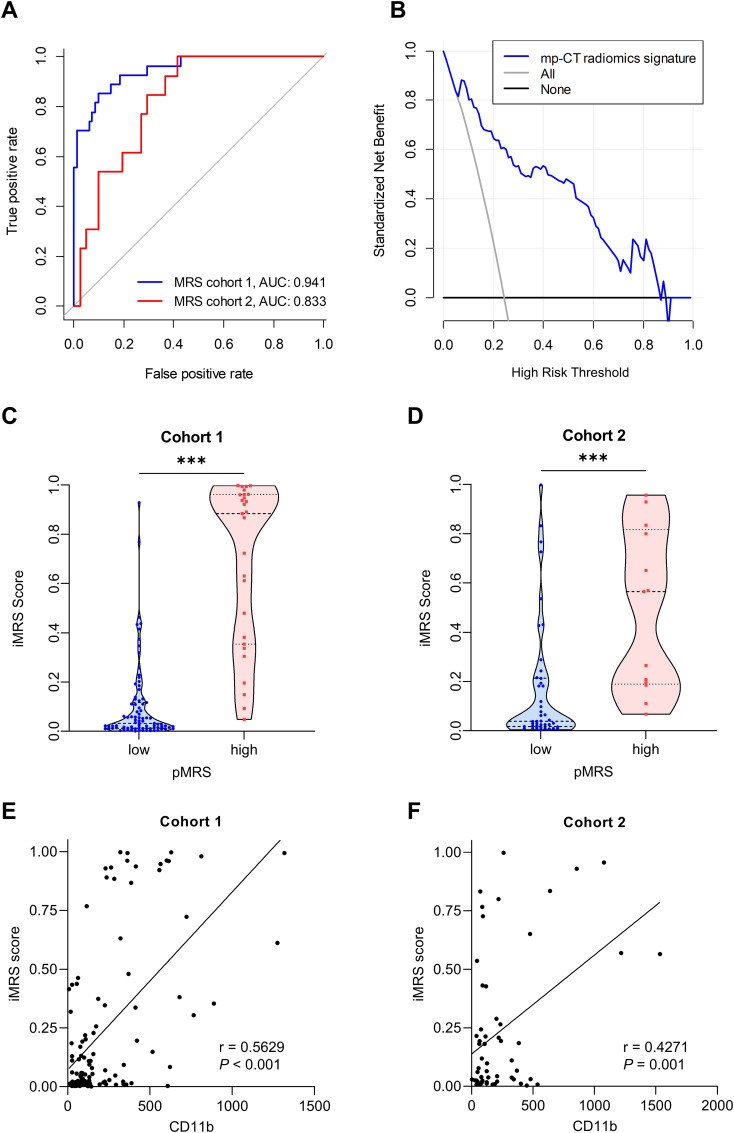
Figure 3.
Performance of the radiomics signature. (A) ROC curves of the optimal mp-CT radiomics signature in cohorts 1 and 2. (B) Decision curve analysis. (C, D) iMRS of patients in pMRS-high or -low groups in cohort 1 (C) and cohort 2 (D). Mann–Whitney test, ***p < 0.001. (E, F) The correlations between the number of tumor-infiltrating CD11b+ cells and iMRS in cohort 1 (E) and cohort 2 (F). Spearman correlation analysis. ROC, receiver operator characteristic; pMRS, pathological MRS.

