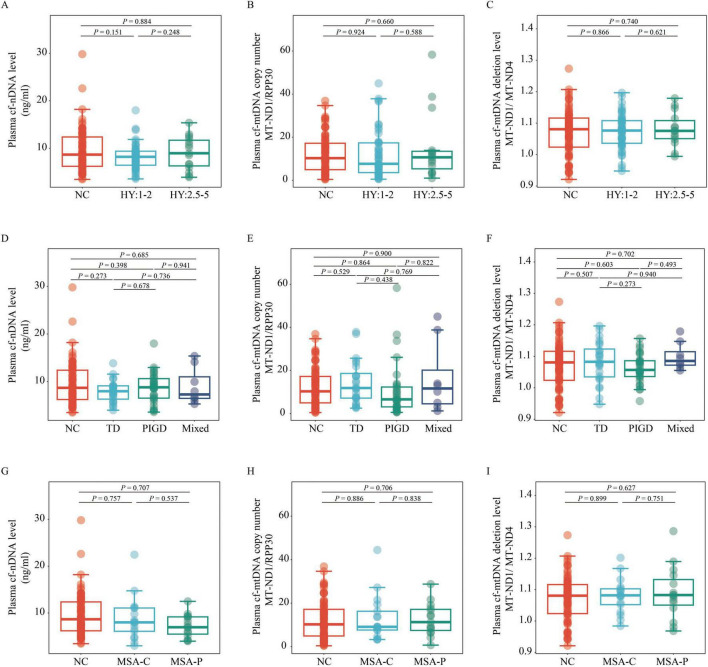
FIGURE 2.
Comparison of plasma cf-nDNA levels, cf-mtDNA copy numbers and cf-mtDNA deletion levels between NC (n = 76) and patients with various PD and MSA subtypes. The figure displays variations in plasma cf-nDNA levels [RPP30; panels (A,D,G)], cf-mtDNA copy numbers [MT-ND1 to RPP30 ratio; panels (B,E,H)], and cf-mtDNA deletion levels [MT-ND1 to MT-ND4 ratio; panels (C,F,I)]. Panels (A,B,C) classify PD into early stages (H&Y stage 1–2; n = 47) and mid-late stages (H&Y stage 2.5–5; n = 15). Panels (D,E,F) classify PD into TD (n = 24), PIGD (n = 30), and Mix (n = 8) groups. Panels (G,H,I) classify MSA into MSA-C (n = 18) and MSA-P (n = 15) subtypes. Statistical analysis was conducted using multivariable linear regression, adjusted for age, sex, BMI, and education level, to assess P-values. Boxplots depict the median and IQR, with whiskers extending to values within 1.5 times the IQR. Data points outside the whiskers are labeled as “outliers.” PD, Parkinson’s disease; MSA, multiple system atrophy; NC, normal control; TD, tremor dominant; PIGD, postural instability and gait disorder; Mix, mixed symptomatology; H&Y, Hoehn and Yahr; MSA-C, Multiple System Atrophy-Cerebellar type; MSA-P, Multiple System Atrophy-Parkinsonian type; cf-mtDNA, circulating cell-free mitochondrial DNA; cf-nDNA, circulating cell-free nuclear DNA; IQR, interquartile range.

