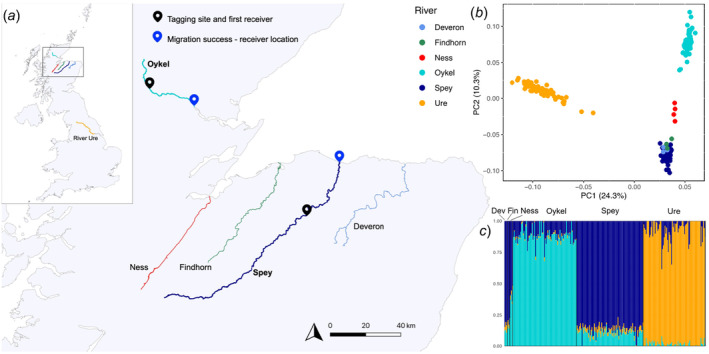
FIGURE 1.

The study area (a) and genetic structuring (b, c) of Atlantic salmon populations from rivers flowing into the Moray Firth (Scotland), with samples from the River Ure (England, (a) top left panel) for comparison. Tagging locations and acoustic receivers are shown in map (a). The principal components analysis (PCA) and the ADMIXTURE analysis plots are based on 44,504 SNPs pruned for linkage disequilibrium. In the PCA scatterplot (b), dots represent individual fish, and variance (%) explained by the first and second axes are shown. Colours correspond to rivers. In the ADMIXTURE plot (K = 3; c), each fish individual is represented by a vertical bar. ‘Dev’ and ‘Fin’ are abbreviations for the Rivers Deveron and Findhorn respectively.
