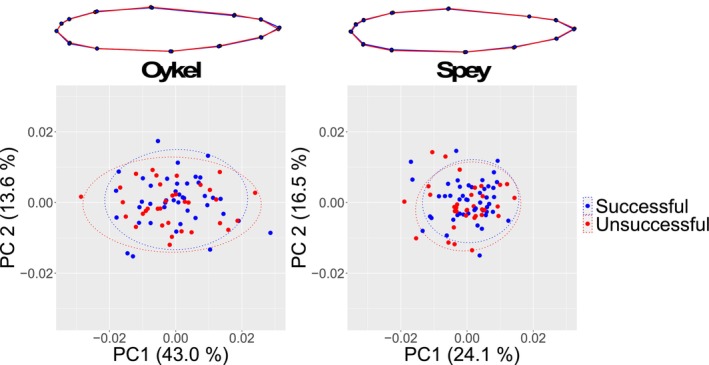
FIGURE 5.

Mean body shape projections (top) and principal components analysis scatterplots (lower panel) show an absence of shape difference between the migratory groups. Procrustes‐aligned coordinates of successful (blue) and unsuccessful (red) Atlantic salmon, where dots represent individual fish are shown below. Variance (%) explained by the first and second axes and 95% confidence ellipses are displayed. Projections show a complete overlap of the blue (successful) and red (unsuccessful) lines in both rivers despite magnifying morphological differences three times to aid visualisation.
