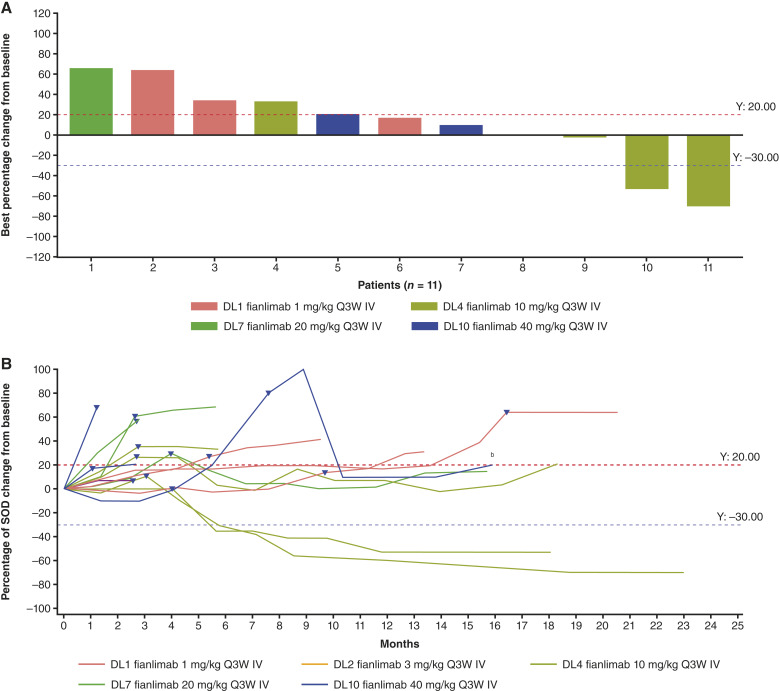
Figure 2.
A, Clinical activitya and (B) changes to target lesion over time in patients treated with monotherapy to combination therapy. aBest overall response is calculated on the basis of tumor change from the start of combination treatment. bTumor response for this patient was calculated as the best change in tumor size from the start of combination therapy. Triangles denote the last tumor assessment on fianlimab monotherapy. Figure only includes patients who had both baseline and postbaseline target lesion assessments; not all patients had these assessments—therefore some patients may not be shown in this figure. Three patients (3/16, 18.8%) were not evaluated in this treatment group. DL, dose level; IV, intravenous; Q3W, every 3 weeks; SOD, sum of diameters.

