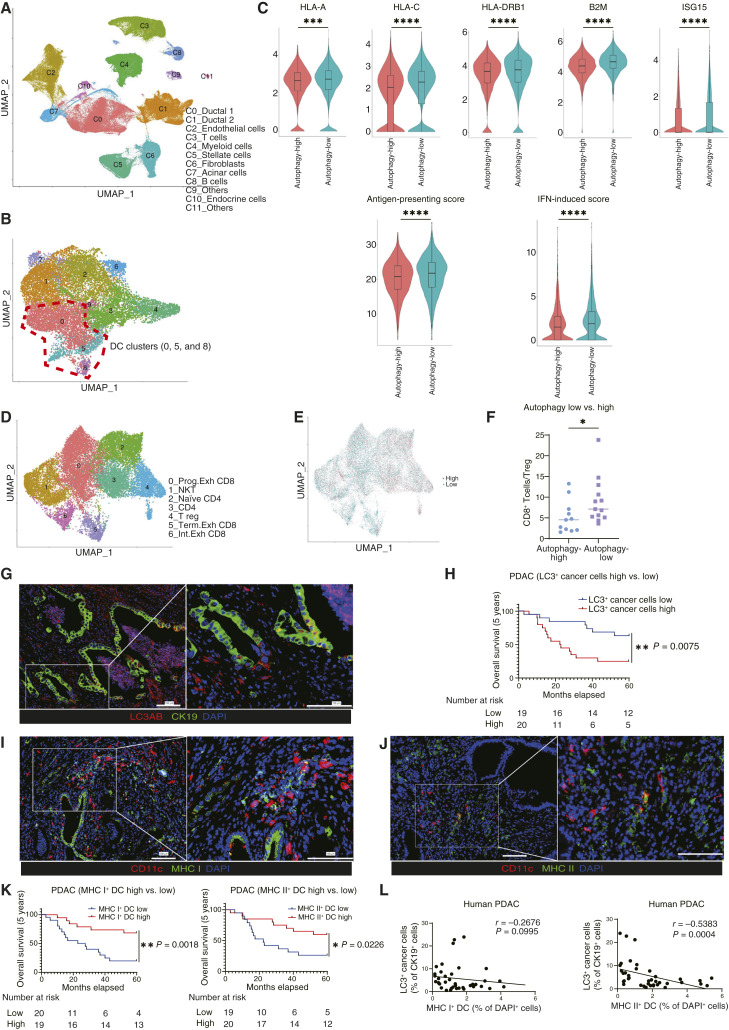
Figure 1.
The autophagy level of cancer cells is negatively correlated with the extent of DC activation in patients with PDAC. A, Analysis of a publicly available scRNA-seq dataset generated by Peng and colleagues (CRA001160; ref. 45), which contains data from 24 primary human PDAC tumors and 10 control pancreases. B, The myeloid cluster (C4) was reclustered into nine clusters. Clusters of “0,” “5,” and “8” were identified as DCs. C, The expression levels of gene sets related to DC functions were analyzed in the overall DC cluster. The expression levels of representative genes are shown as violin plots. The “antigen-presenting score” and “IFN-induced score” were calculated for the comparison of the “autophagy-high” and “autophagy-low” groups. D, The T-cell cluster (C3) was reclustered into seven clusters. E, T cells were divided into cells derived from the autophagy-high group (red) and those derived from the autophagy-low group (green). F, The ratio of CD8+ T cells to Tregs (%) in the autophagy-high and autophagy-low groups. G, IF analysis of 39 PDAC patient samples. Autophagy levels in cancer cells were evaluated by staining for LC3AB (red) and CK19 (green). Representative images are shown. H, Kaplan–Meier overall survival analysis of patients with PDAC according to their cancer cell autophagy levels, defined by the ratio of LC3AB+ CK19+ cells to CK19+ cells. I and J, Representative IF images of activated DCs, expressing CD11c (red) and MHC I/II (green). K, Kaplan–Meier overall survival analysis of activated DCs, defined by the ratio of MHC I+ CD11c+ cells to DAPI+ cells from I and MHC II+CD11c+ cells to DAPI+ cells from J. L, Spearman correlation between the autophagy levels of cancer cells (% LC3AB+ CK19+ cells/CK19+ cells) and activated DCs (% MHC I+CD11c+ cells/DAPI+ cells or % MHC II+ CD11c+ cells/DAPI+ cells). Scale bars, 100 μm (G, I, and J). Bars, median; boxplots show a centerline, median; box limits, upper and lower quartiles; whiskers that extend up to 1.5× the IQR beyond the upper and lower quartiles (C). *, P < 0.05; **, P < 0.01; ***, P < 0.001; ****, P < 0.0001; analyzed using the Wilcoxon rank-sum test (C), Student t test (F), and log-rank test (H and K).

