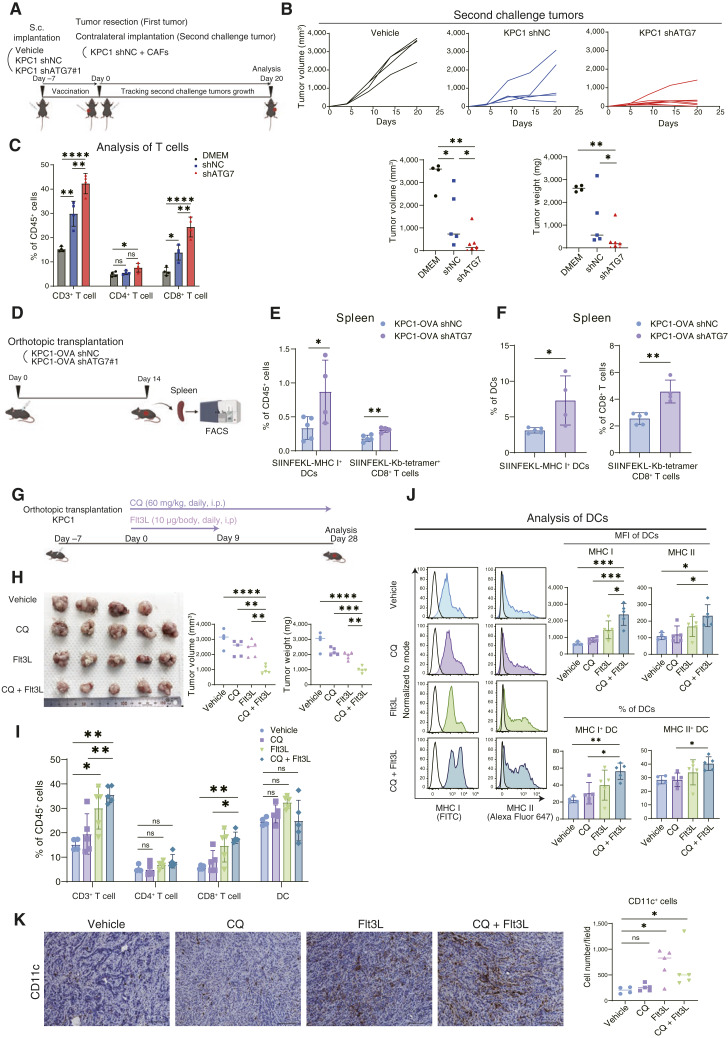
Figure 4.
Combination of autophagy inhibition and DC induction synergistically suppresses tumor growth. A, Schematic outline of the in vivo vaccination experiment. B, Individual tumor growth curves and the corresponding quantification (on day 20) of the secondary challenge tumors from mice vaccinated with vehicle, KPC1 shNC, or KPC1 shATG7. C, Flow cytometry analysis of tumor-infiltrating lymphocytes in the secondary challenge tumors. D, Schematic outline of the experimental procedure used to evaluate antigen-specific CD8+ T cells in vivo. E and F, KPC1-OVA shNC or shATG7 tumors were orthotopically transplanted into C57BL/6 mice. Fourteen days later, the spleens were resected and analyzed by flow cytometry; DCs presenting the OVA-derived peptide SIINFEKL and antigen-specific CD8+ T cells bound to the H-2Kb OVA tetramer-SIINFEKL were quantified. The percentages of SIINFEKL-MHC I+ DCs and antigen-specific CD8+ T cells within the total CD45+ cell population were evaluated (E). The percentages of SIINFEKL-MHC I+ DCs/total DCs and antigen-specific CD8+ T cells/total CD8+ T cells were also assessed (F). G, Schematic outline of the treatment experiment used to assess the synergy between CQ and Flt3L in vivo. H–K, KPC1 tumors were orthotopically transplanted into C57BL/6 mice. Tumor-bearing mice were treated with vehicle, CQ (60 mg/kg), Flt3L (10 µg), or CQ + Flt3L. After 28 days of treatment, the tumor volumes and weights were measured (H). Flow cytometry was then used to determine the extent of tumor-infiltrating T-cell (I) and DC activation (J). The mean fluorescence intensities (MFI) of MHC I/II in DCs and the percentage of MHC I/II+ DCs (% of DCs) are shown (J). IHC analysis for CD11c was performed to assess the absolute number of DCs infiltrating in tumors (K). Scale bars, 100 μm (K). Bars, median; Error bars, mean ± SD. *, P < 0.05; **, P < 0.01; ***, P < 0.001; ****, P < 0.001; analyzed using the one-way ANOVA (C and H–J), Student t test or Mann–Whitney test (B, E, F, and K). (A,D, and G, Created with BioRender.com.)

