Figure 5.
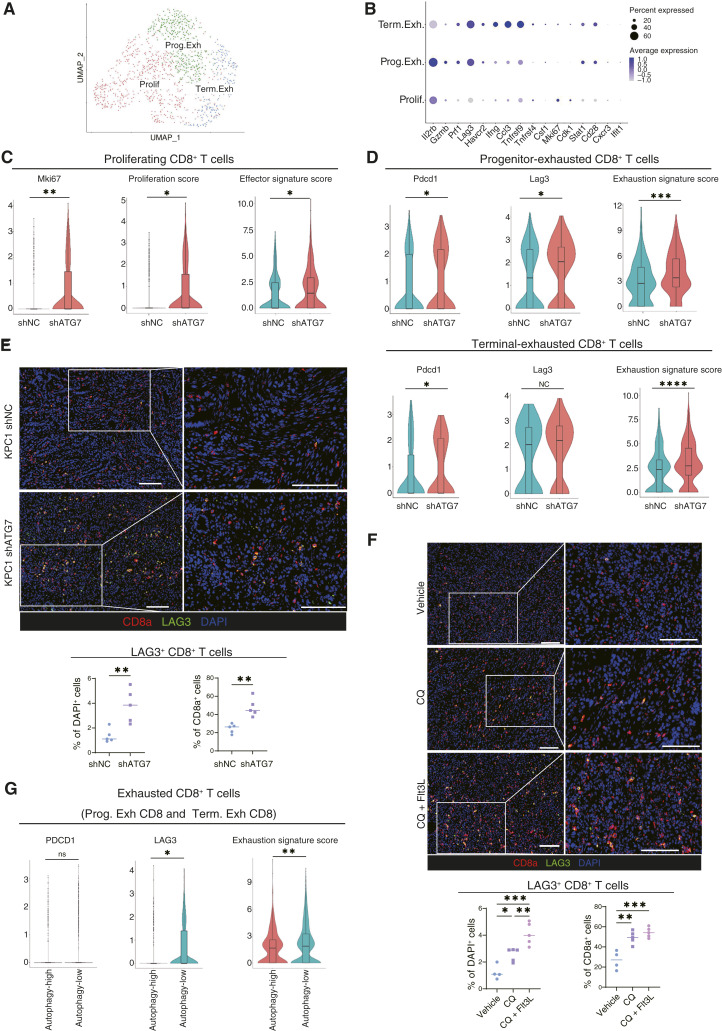
Autophagy inhibition in cancer cells induces exhaustion of tumor-infiltrating CD8+ T cells, characterized by high LAG3 expression. A, scRNA-seq analysis of CD8+ T cells from the immune cell populations shown in Fig. 1A. CD8+ T cells were reclustered into three clusters. B, Expression of key signature genes used to identify the specific CD8+ T-cell clusters. C and D, The expression levels of gene sets related to CD8+ T-cell function was analyzed in the Prolif (C), Prog. Exh, and Term. Exh (D) CD8+ T cells. “Proliferation score,” “effector signature score” (C), and “exhaustion signature score” (D) were calculated using the gene sets listed in Supplementary Table S9. E and F, Representative IF images of orthotopic syngeneic KPC1 shNC/shATG7 tumors (E) and orthotopic syngeneic KPC1 tumors treated with the combination therapy (CQ ± Flt3L; F). Red, CD8a; green, LAG3. Quantification of LAG3+ CD8a+ cells/DAPI+ cells (%) and LAG3+ CD8a+ cells/CD8a+ cells (%) is shown. G, The expression levels of featured genes related to T-cell exhaustion were analyzed in exhausted CD8+ T-cell clusters (“5” and “6” in Fig. 1D) in human PDAC scRNA-seq data. Scale bars, 100 µm (E and F). Bars, median; boxplots show a centerline, median; box limits, upper and lower quartiles; whiskers that extend up to 1.5× the IQR beyond the upper and lower quartiles (C, D, and G). *, P < 0.05; **, P < 0.01; ***, P < 0.001; ****, P < 0.0001; analyzed using the Wilcoxon rank-sum test (C, D, and G), Student t test (E), and one-way ANOVA (F).

