. 2024 Dec 12;14(12):e078210. doi: 10.1136/bmjopen-2023-078210

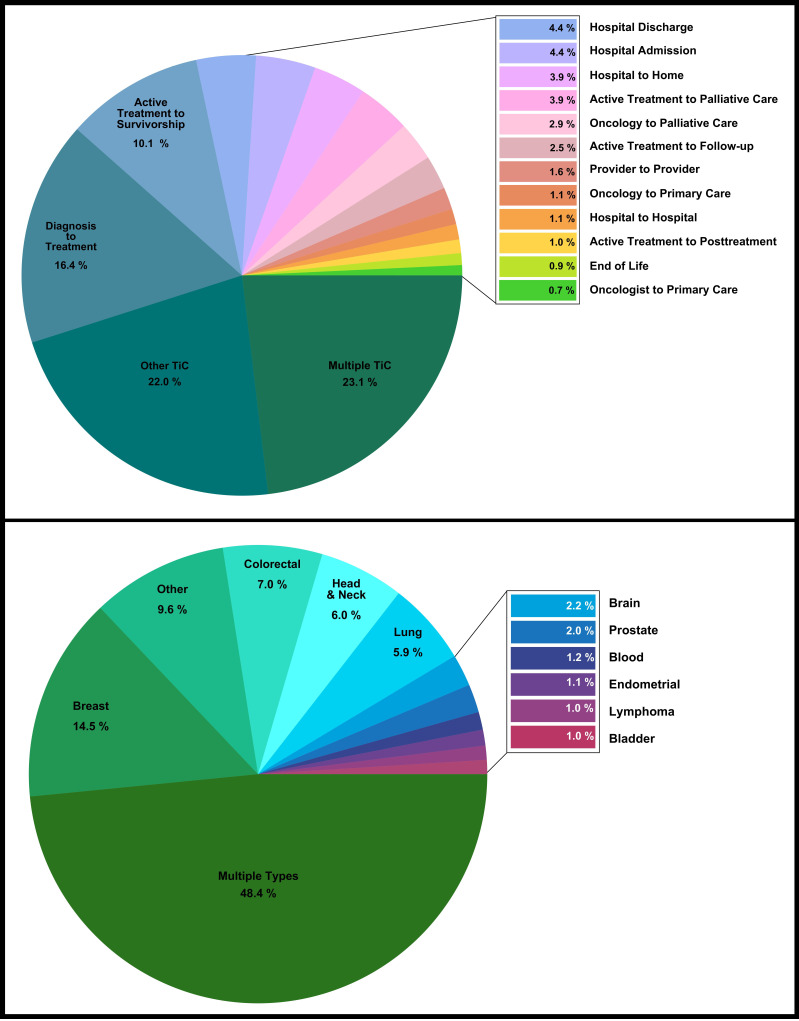
Figure 2. Pie charts that categorise cancer type (top) and Transitions in Care (TiC) type (bottom) of the included evidence sources. Different colours describe different categories. The total percentage of the categorised cancer type or TiC type is listed below the category (in the pie chart) and beside the side boxes. The thin black lines connected to the coloured boxes denote any cancer or TiC types that were unable to fit within the pie chart. The TiC diagnosis to treatment contains diagnosis to treatment and diagnosis to surgery. Discharge includes any discharge from a healthcare provider, facility or institution. Readmission includes any readmission to a healthcare facility or institution.

Figure 2