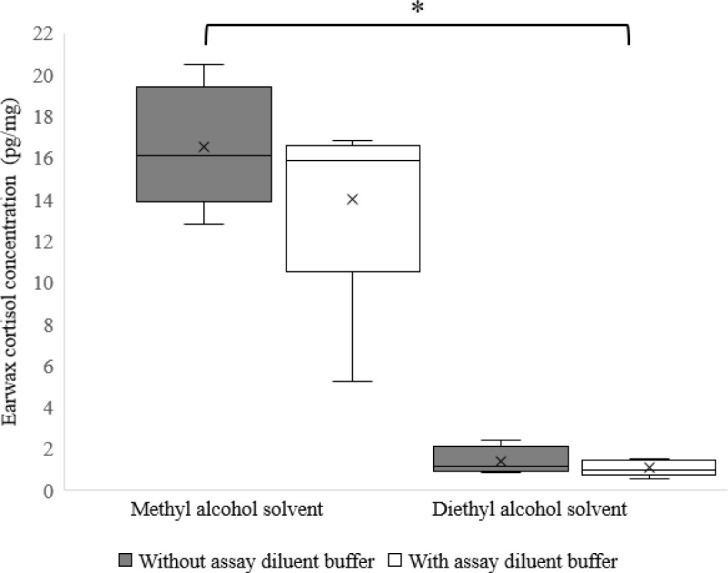
Fig. 3. Boxplot showing differences in earwax cortisol concentration between methyl alcohol and diethyl ether extractions without and with the addition of assay diluent buffer.

Error bars represent the range of minimum and maximum cortisol values observed in earwax matrix and the symbol x represents the mean. The symbol * indicates significant differences (p < 0.05).
