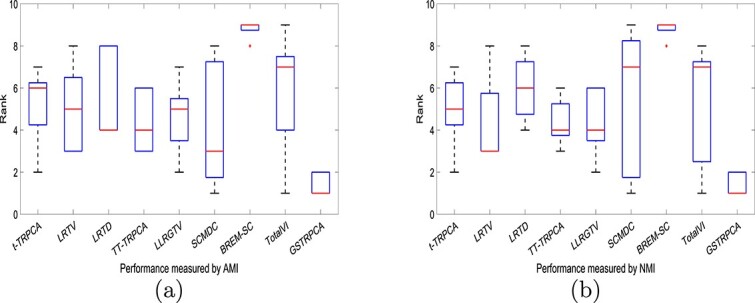
Figure 3.

(a) Boxplots of GSTRPCA and other competing methods in terms of AMI on five datasets. (b) Boxplots of GSTRPCA and other competing methods in terms of NMI on five datasets. The minimum value, lower quartile, median (red line), upper quartile, and maximum value are shown. The length of a box (the interquartile range) indicates the stability of the method; the bigger the range the more unstable the method is, and a high ranking in the relative stability indicates a better method.
