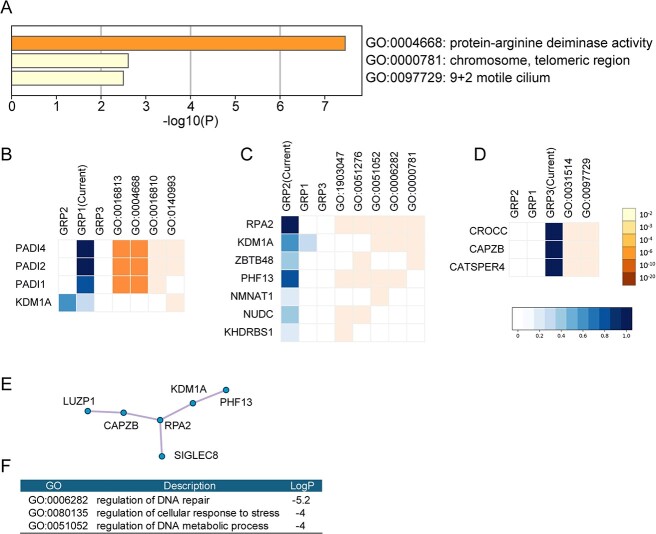
Figure 7.
Enrichment analysis of 50 differentially expressed marker genes using Metascape. (A) Enriched GO terms under the biological process category. The colors are based on the P-values. (B–D) Heatmaps of genes associated with the three best-scoring GO groups, GRP1 (B), GRP2 (C), and GRP3 (D). The blue heatmaps (left) represent genes across groups. The darkness of the blue indicates the proportion of GO terms in a group associated with the gene. The orange heatmaps (right) represent genes across terms in the activated group. The darkness of the orange indicates the P-value of the GO term. (E) Protein–protein interaction network identified in the marker genes. (F)The three best-scoring GO terms by P-value.

