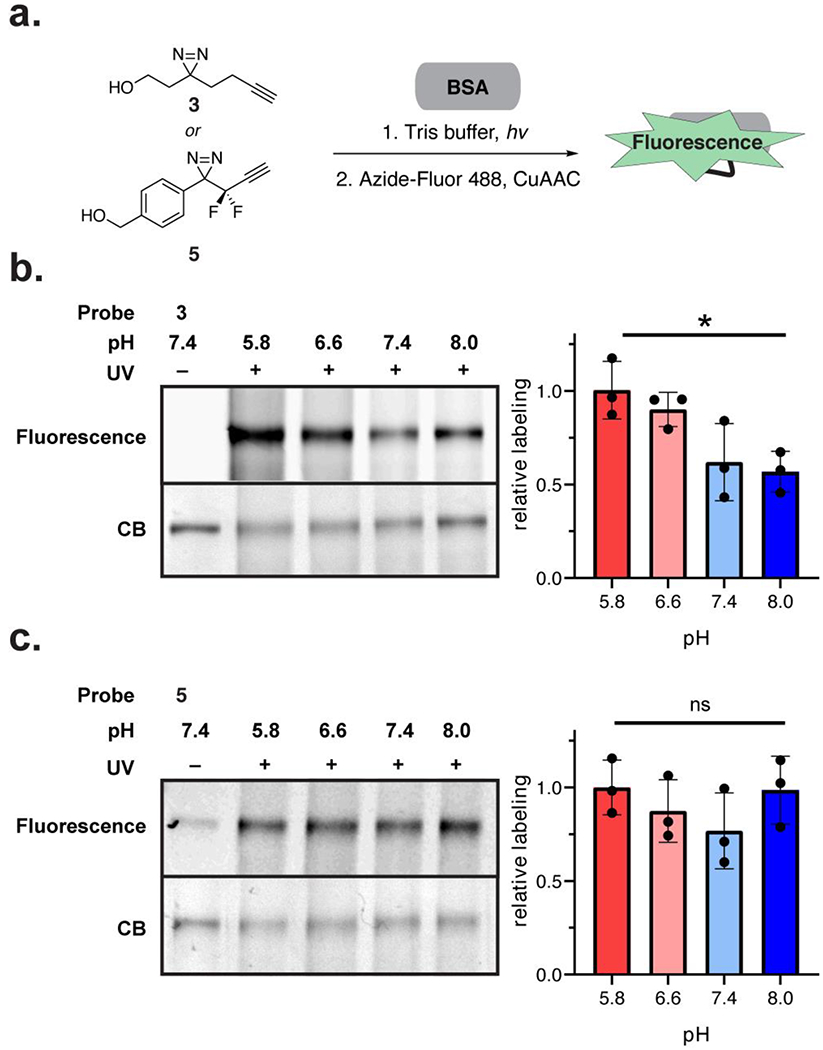
Figure 3.

Photolabeling of single proteins as a function of pH. (a) Workflow schematic. Alkyl diazirine 3 or aryl-difluorodiazirine 5 were incubated with BSA in Tris buffer with varying pH (5.8, 6.6, 7.4, 8.0). The diazirines were crosslinked to the protein by UV irradiation and visualized by in-gel fluorescence following click chemistry with Azide-Fluor 488. (b) pH-dependent labeling of BSA by alkyl diazirine 3. (c) pH-independent labeling of BSA by aryl diazirine 5. Labeling yields were calculated with fluorescence signal normalized to coomassie blue (CB) stain signal. Plotted values show the mean with error bars representing the standard deviation with n = 3. Statistical significance was determined with a t-test between pH 5.8 and 8.0 samples (* = p-value < 0.05)
