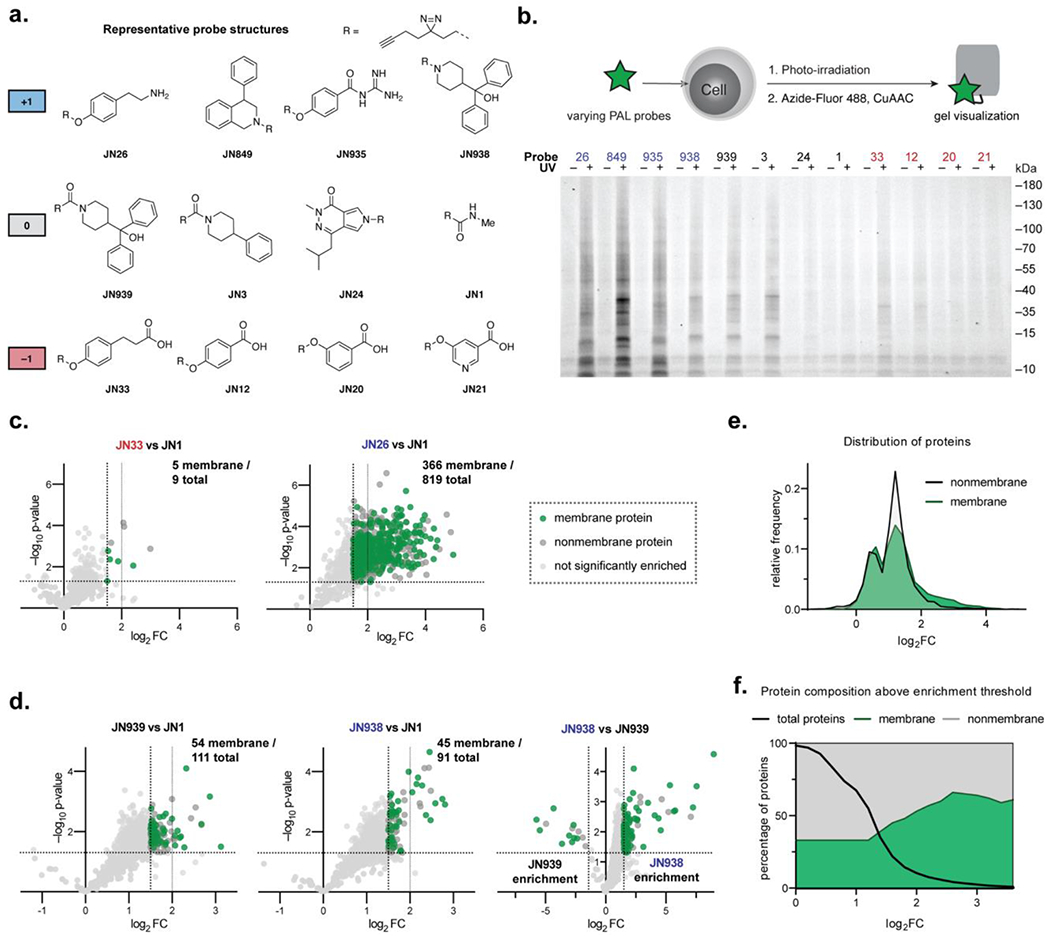
Figure 4.

Whole proteome photolabeling in cells with PAL probes. (a) Representative probe structures (for a full list see Figure S8). (b) Photolabeling yields of compounds visualized by fluorescence signal. (c) Comparison of photolabeling profiles of carboxylic acid probe JN33 and primary amine JN26. Significantly enriched proteins are colored as membrane and nonmembrane proteins. (d) Photolabeling profiles of neutral amide probe JN939 and positively-charge amine analogue JN938. (e) Histogram showing the relative frequency of membrane and nonmembrane protein enrichments for all data in (c) and (d). (f) Percentage of membrane proteins above enrichment thresholds for all data in (c) and (d).
