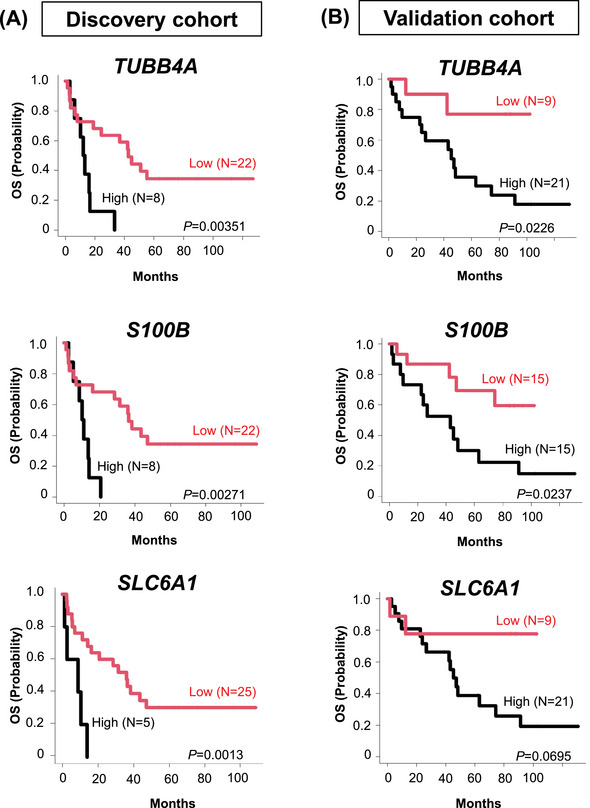
FIGURE 2.

Clinical impact of extracted three prognostic genes in the discovery and validation cohort. Kaplan–Meier curves show the duration of OS based on expression levels of unfavorable candidate genes in the discovery (left) and the validation (right) cohorts. Statistical analysis was performed using the two‐sided log‐rank test. OS, overall survival.
