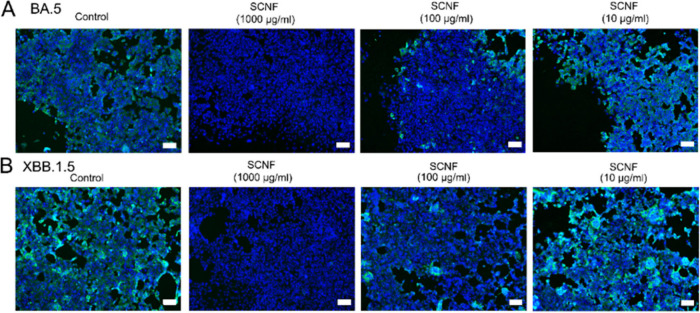
Figure 5.
Immunofluorescent images revealing the infected cells in the preinfection inhibition assay toward (A) SARS-CoV-2 BA.5 and (B) XBB.1.5 variants. The cell nuclei are stained with Hoechst 33342 (blue signal), while the infected cells are stained by antibody against SARS-CoV-2 N protein (green signal). Scale bar = 100 μm.

