Figure 4.
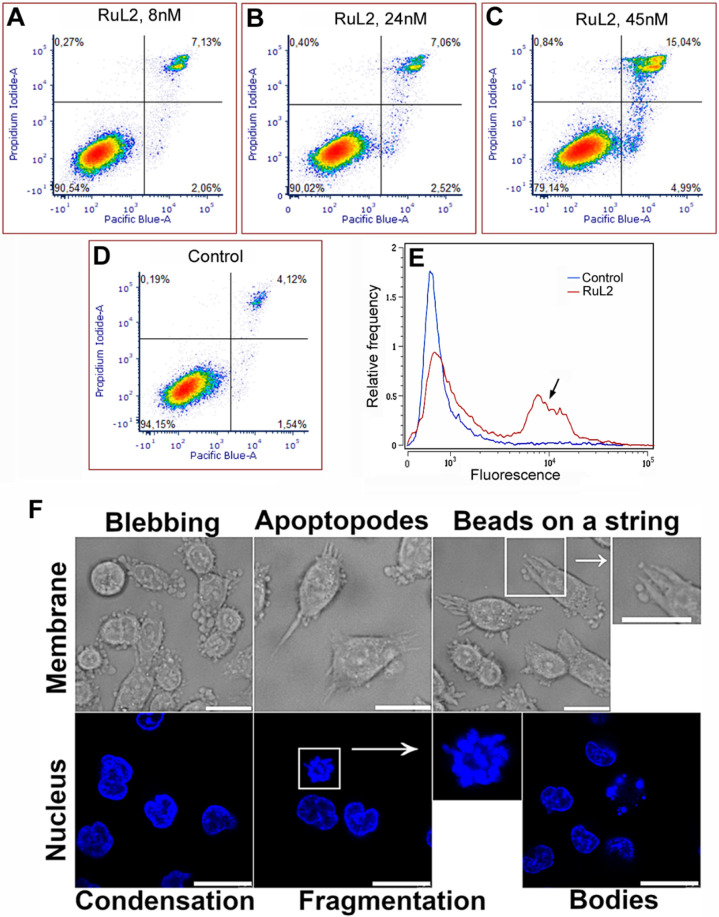
(A–D) Representative density plots of HCT116 cells after their PI/annexin V Pacific blue staining. Before staining, cells were incubated with RuL2 in the dark (1 h) and irradiated with blue light (1 h). Control, untreated cells were irradiated as well. Then, the cells were allowed to recover in Ru-free media for 24 h. Early apoptotic cells are in the right lower quadrant (annexin V-positive, PI-negative), whereas cells undergoing necrotic processes are in the left upper quadrant (annexin V-negative and PI-positive). The signals in the right upper quadrant (both annexin V and PI-positive) represent dead (necrotic and late apoptotic) cells. (E) Activation of caspase 3 in HCT116 cells as detected by CellEventCaspase3/7 Green Detection Reagent using flow-cytometry. Representative histograms of untreated irradiated control (in blue) or cells treated and irradiated with RuL2 are shown. Caspase 3 positive cell population is indicated by arrow; 10,000 cells were analyzed in each sample. (F) Apoptotic morphological features assessed in HCT116 cells following treatment with RuL2. Cells were exposed to 50 nM of RuL2 for 2 h (1 h in dark, 1 h irradiation with 420 nm light). Morphological alterations in the cytoplasmic membrane were evaluated using bright field microscopy 90 min postirradiation. The scale bar in the bright field images represents 20 μm. Apoptosis-related changes in nuclear morphology were analyzed through confocal microscopy utilizing Hoechst dye staining. The time-lapse observations of nuclear morphological changes included nuclear condensation and fragmentation at 90 min and the formation of apoptotic bodies at 150 min after irradiation. Scale bars in the confocal images denote 20 μm.

