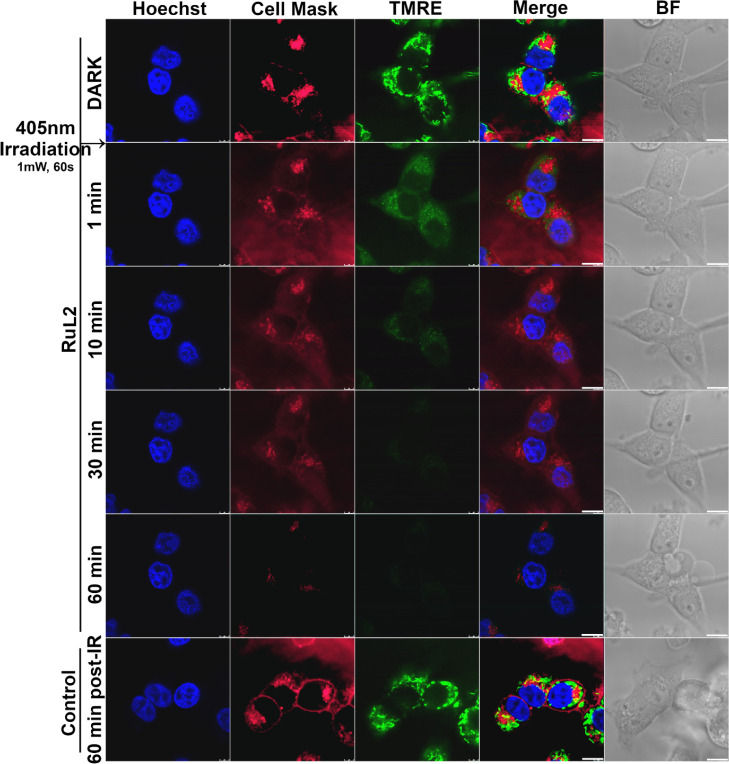
Figure 5.
Analysis of HCT116 cells by confocal microscopy. Cells were treated with 80 nM of RuL2 for 2 h in EBSS. Then, samples were stained with Hoechst 33342, CellMask deep red (λem = 680 nm), and TMRE (λem = 590 nm, shown in green for clarity). Samples were irradiated with blue laser light 405 nm (1 mW, 60 s). The scale bar in the images represents 10 μm.

