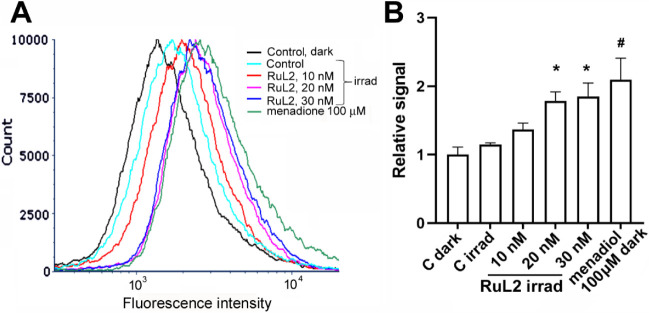
Figure 6.
(A) Representative histograms of lipid peroxidation in HCT116 cells analyzed by flow cytometry. Cells were treated for 2 h (1 h dark, 1 h irradiation 420 nm) with an increasing concentration of RuL2. Positive control menadiol (100 μM, 2 h in dark) was also included in the experiment. Samples were stained with Bodipy 665/676 lipid peroxidation sensor. (B) Quantitative evaluation of the experiment. Data represent a mean ± SD from two measurements; (3–4) × 104 cells were analyzed in each sample. * = significantly different from irradiated control (p < 0.05); # = significantly different from control kept in the dark (p < 0.05).

