Figure 6.
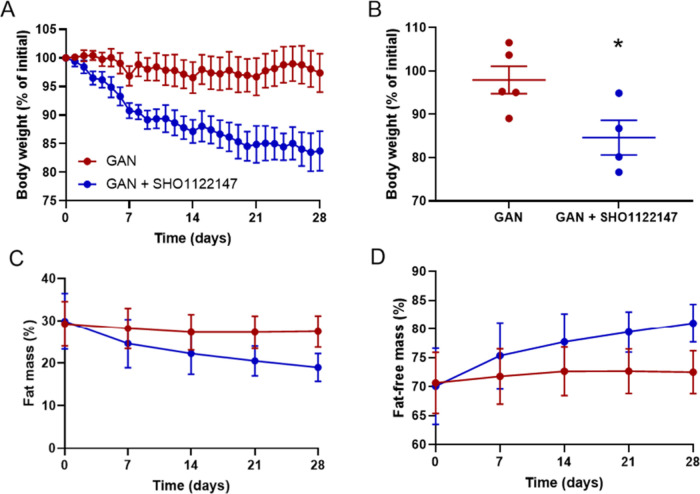
SHO1122147 decreases body weight while improving body composition in the GAN mouse model of NASH. (A, B) Body weight represented as percentage of initial weight (A) over time and (B) at the end of treatment. Measurements of (C) body fat and (D) lean mass represented as percentage of body weight over time. Values are shown as mean ± SEM (n = 4–5). *p < 0.05 compared with GAN, determined by unpaired parametric t test (two-tailed).

