Fig. 1.
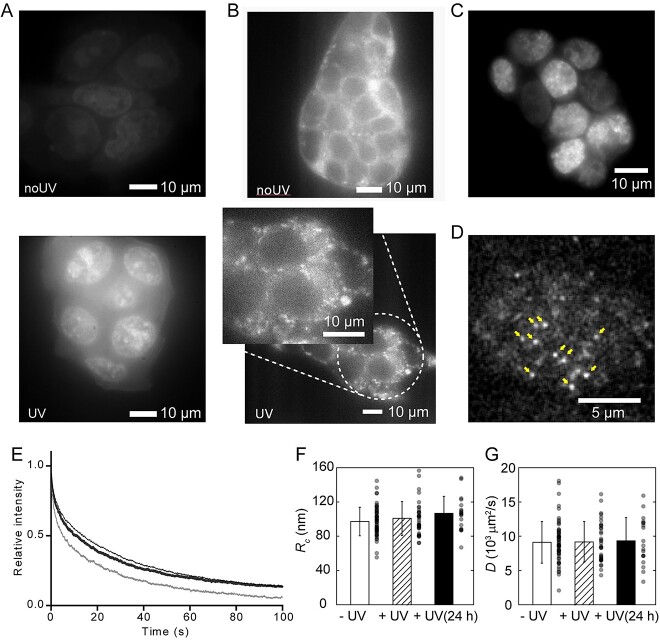
Effects of UV radiation on mESCs. (A) Cells stained with CellROX without (above) or with (below) UV irradiation. (B) Cells stained with MitoTracker without (above) or with (below) UV irradiation. (Inset) Magnified image showing the fragmented mitochondria. (C) Fluorescent image of mouse ESCs expressing the Nanog-GFP after UV irradiation. (D) Single molecules of Nanog-GFP observed via HILO illumination. Typical single-molecule fluorescence spots are indicated by arrows. (E) Time-dependent change in fluorescent intensity during photobleaching before single molecule observation of Nanog-GFP-expressing mouse ESC nucleus without UV irradiation (hairline) just after UV irradiation (thin line) and 24 h after UV irradiation (thick line). (F, G) Confined radius (Rc) (F) and diffusion constant (D) (G) measured via single-molecule tracking without UV irradiation (open) just after UV irradiation (dashed) and 24 h after UV irradiation (filled). Error bar represents the standard deviation (SD). n = 35 for –UV, 56 for +UV and 19 for +UV (24 h). Reproduced from Okamoto et al., 2023 [31].

