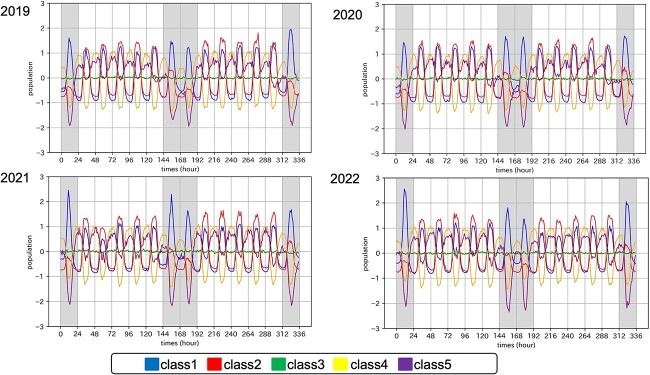
Fig. 2.
Four-year demographics of the target area with clustering group. Figure 2 shows the demographics of the target area divided into five classes. The vertical axis illustrates the z-scored population change. The mean of each group, obtained by clustering, is visualized annually. The horizontal axis represents a two-week period, spanning 24 hours times 14 days. Darker-colored areas indicate weekends.

