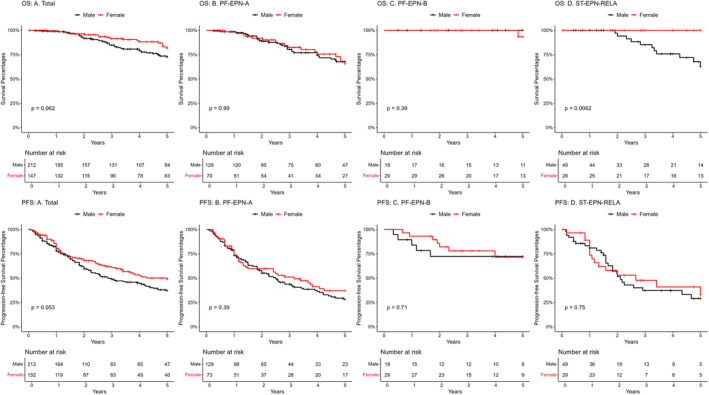
FIGURE 1.

Kaplan–Meier survival curves showing five‐year overall survival (OS) and five‐year progression‐free survival (PFS) for those subgroups with less than 100% survival at 5 years by sex from the Pajtler data. (OS: A) Total, (OS: B) PF‐EPN‐A, (OS: C) PF‐EPN‐B, (OS: D) ST‐EPN‐RELA, (PFS: A) Total, (PFS: B) PF‐EPN‐A, (PFS: C) PF‐EPN‐B and (PFS: D) ST‐EPN‐RELA.
