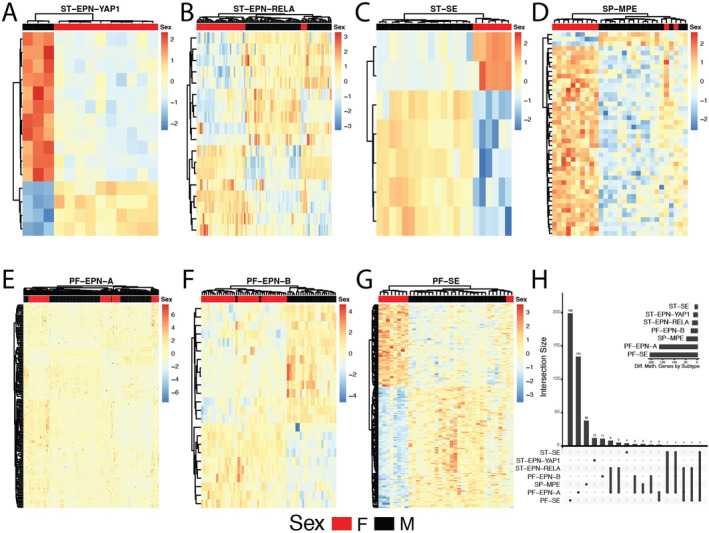
FIGURE 2.

Heatmaps showing methylation levels (row‐scaled b‐values) of statistically significant differentially methylated positions (DMPs) by sex within ependymoma subgroups: (A) ST‐EPN‐YAP1, (B) ST‐EPN‐RELA, (C)ST‐SE, (D) SP‐MPE, (E) PF‐EPN‐A, (F) PF‐EPN‐B, (G) PF‐SE and (H) Upset plot showing unique and shared differentially methylated genes across ependymoma subgroups from the Pajtler data.
