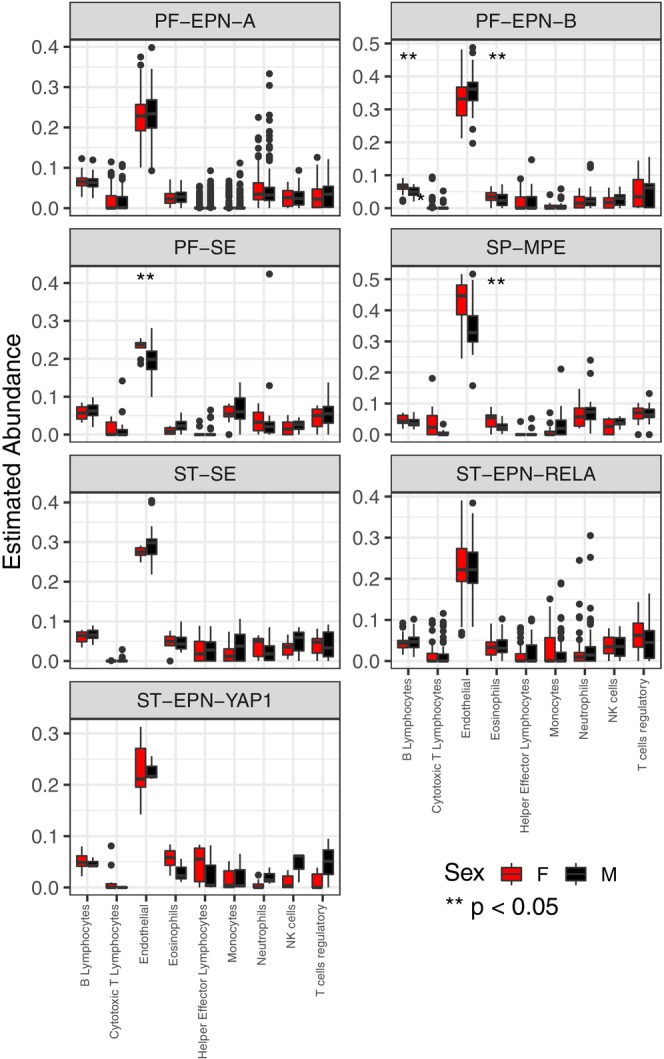
FIGURE 3.

MethylCIBERSORT stromal signature matrix within ependymoma subgroups from the Pajtler data. Boxplots compare ependymoma subgroup means for each cell type. Significance was calculated using pairwise Wilcoxon Rank Sum tests. p values (Boxplots here compare female (red) and male (black) means for each cell type in each ependymoma subgroup as labelled. ** p value used for significance was ≤ 0.05.
