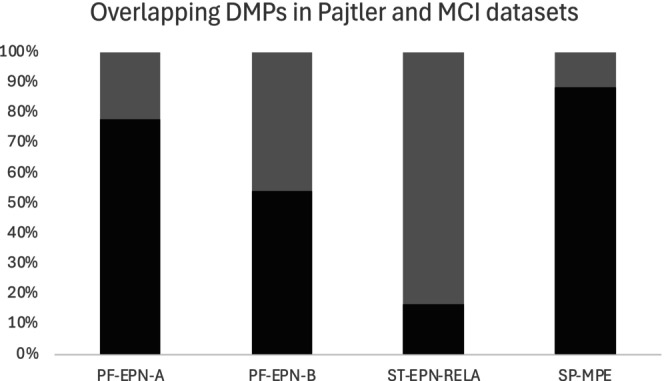
FIGURE 4.

Percent of overlapping DMPs found within Pajtler and MCI datasets. Here, 100% shows the sex DMPs in each subgroup in the Pajtler dataset, and the grey bar indicates the overlapping sex DMPs that were also statistically significantly differentially (FDR < 0.05) methylated in the MCI dataset in each subgroup.
