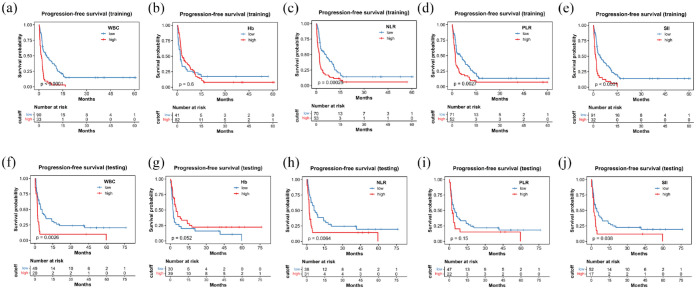
Figure 3.
Kaplan–Meier curve for PFS stratified by WBC, Hb, NLR, PLR, and SII in the training cohort (a–e) and the testing cohort (f–j).
Hb, hemoglobin; NLR, neutrophil-to-lymphocyte ratio; PFS, progression-free survival; PLR, platelet-to-lymphocyte ratio; SII, systemic immune-inflammation index; WBC, white blood cell count.

