Figure 6.

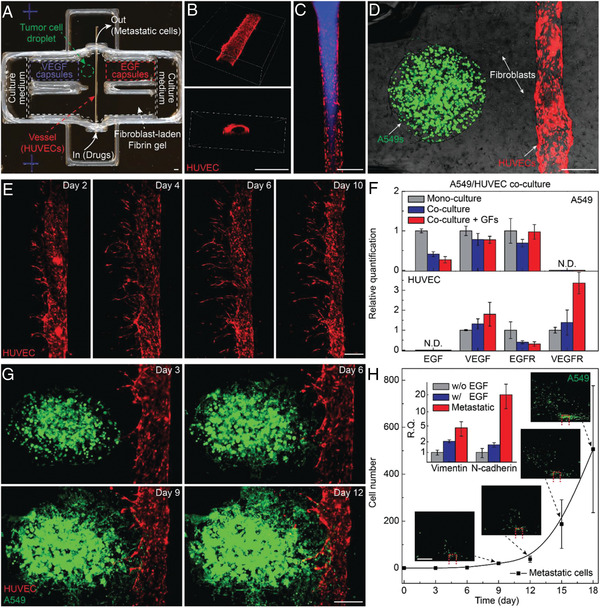
Metastatic tumor model. A) Photo of a 3D printed culture chamber for tests of guided tumor cell dissemination. B) Confocal images of the top view (upper panel) and cross section (lower panel) of a representative microchannel lined by HUVECs within a fibrin gel. C) Fluorescence images showing a vessel perfused by fluorescent fluid (blue). D) Composite image showing a representative tumor model before laser‐triggered rupture of EGF and VEGF capsules (green fluorescence: GFP‐expressing A549 lung carcinoma cells, red fluorescence: RFP‐expressing HUVECs, bright field: fibroblasts). E) Panoramic fluorescence images showing sprouts generated from a main vessel and their extension toward a single direction over. F) Bar chart showing the expression of EGF, VEGF, EGFR, and VEGFR of A549s (upper panel) and HUVECs (lower panel) when mono cell‐cultured and co‐cell‐cultured. G) Fluorescence images of a metastatic model, showing that A549s approach and enter the vasculature through the fibroblast‐laden fibrin gel. H) Plots of the population of disseminated A549s detected in the collection chamber versus time. Inset photos: fluorescence images showing the disseminated A549s in the collection chamber, with the red dash frame showing the vessel position. Inset bar chart: expression of vimentin and N‐cadherin of 3D bioprinted A549s in tumor models without (gray) and with (blue) EGF release, and metastatic tumor cells (red) harvested in collection. Scale bar: 500 µm. Reproduced with permission.[ 120 ] Copyright 2019, Wiley‐VCH GmbH.
