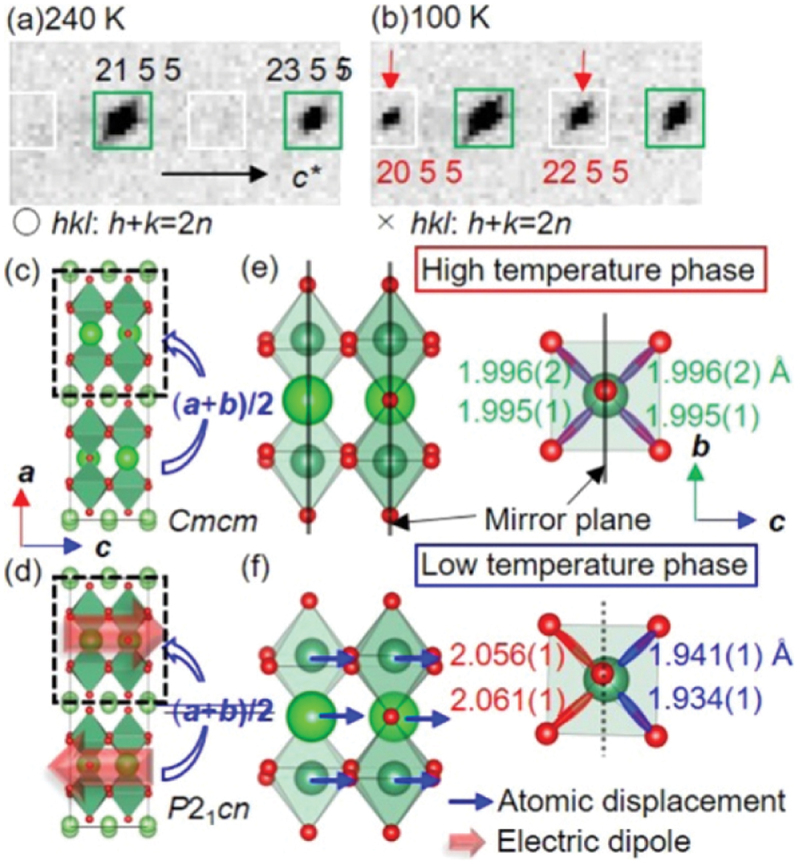
Figure 19.

X-ray diffraction patterns of Li2SrNb2O7 observed at (a) 240 K and (b) 100 K. The crystal structures in the high- and low-temperature phases are illustrated in panels (c) and (e) and panels (d) and (f), respectively. Adapted with permission from ref. [185]. Copyright 2019 American chemical society.
