Figure 5.
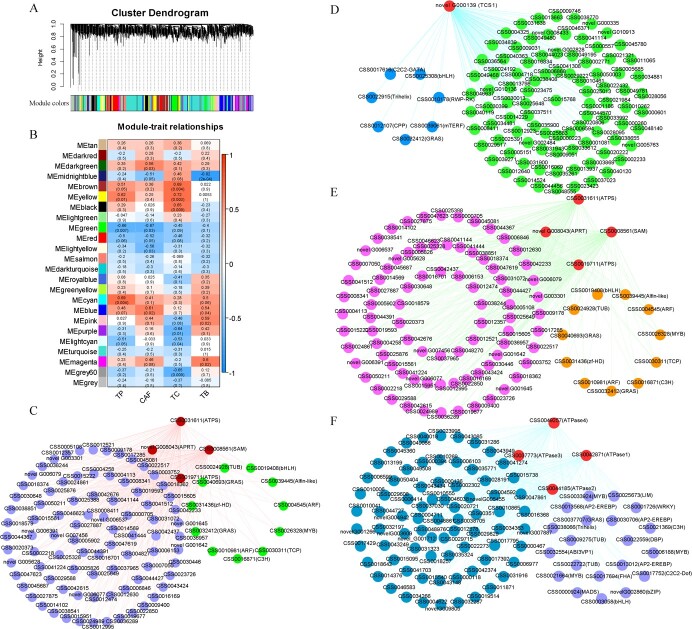
Co-expression network analysis of tea plant purine alkaloids. A WGCNA analysis-based hierarchical clustering tree of modules. B Relationships between modules and the characteristics of the samples tested. The numbers represent R and the numbers in parenthesis represent P values. C Co-expression network diagram of candidate genes in the ME magenta module. D Candidate gene co-expression network diagram in the ME green module. (E) ME brown module co-expression network diagram of candidate genes. F Co-expression network diagram of the candidate genes in the ME cyan module.

