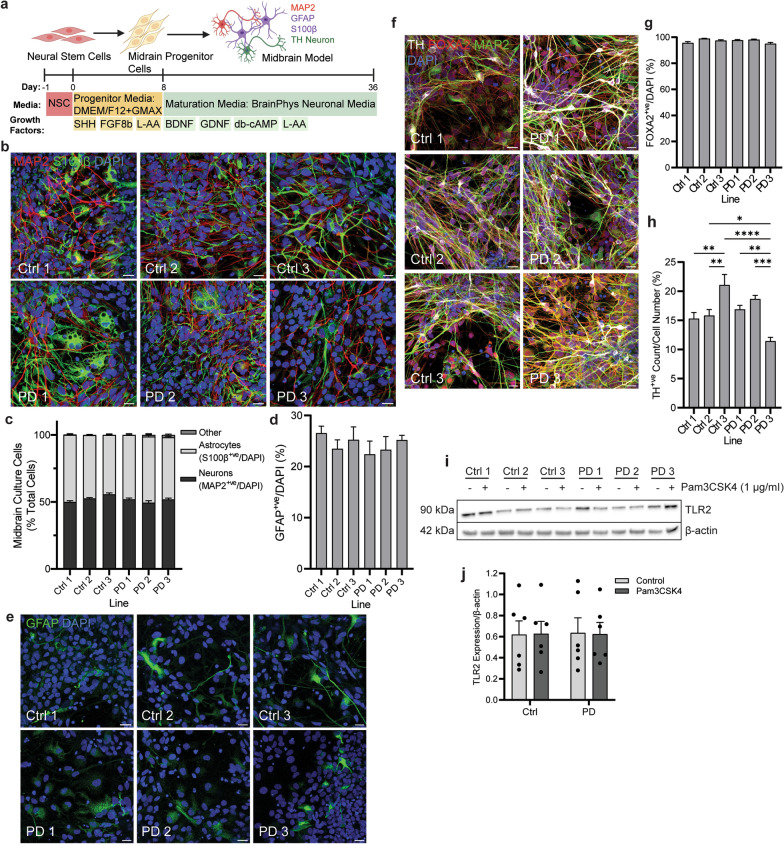
Fig. 1.
Generation and characterisation of midbrain culture from six stem cell PD patient lines. a Diagram of differentiation protocol as published by Zabolocki and colleagues [28]. b Differentiated cells were fixed and stained for astrocyte and neuronal markers S100β (green) and MAP2 (red) respectively. Confocal images taken at 40 × magnification. Scale bar, 20 μm. c Graph shows the numbers of astrocytes and neurons in culture expressed as percentage of total cells, displayed as mean ± SEM. Cells negative for either stain were classified as “other”. d Graph shows the number of GFAP positive astrocytes in culture, expressed as percentage of total cells, displayed as mean ± SEM. e differentiated cells were fixed and stained for astrocyte marker GFAP (green). Confocal images taken at 40 × magnification, scale bar, 20 μm. f Midbrain cells were fixed and stained for DA neuronal markers TH (grey) and FOXA2 (red), and general neuronal marker MAP2 (green). Confocal images taken at 40 × magnification, scale bar, 20 μm. g, h Graphs show the number of FOXA2- and TH-positive cells in culture, respectively, expressed as percentage of the total cells, displayed as mean ± SEM. i Midbrain cells were treated with TLR2 agonist Pam3CSK4 for 24 h and lysed for immunoblot detection of TLR2 with β-actin used as a loading control. j Graph shows quantification of TLR2 expression normalised to β-actin following Pam3CSK4 treatment, displayed as mean ± SEM. For all graphs *P < 0.05, **P < 0.01, ***P < 0.001, ****P < 0.0001

