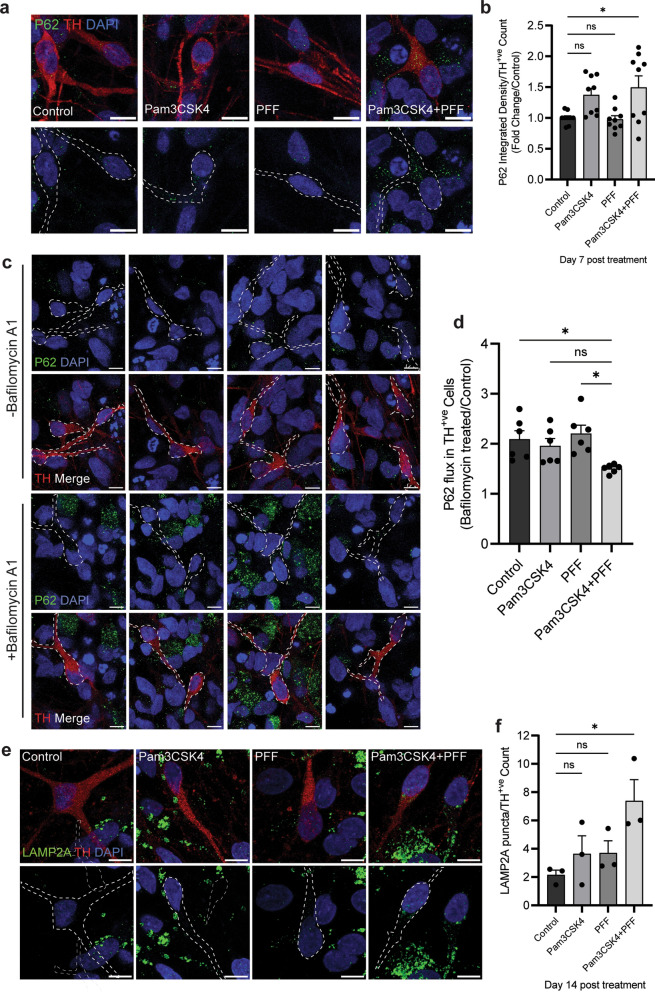
Fig. 6.
TLR2 activation and α-syn PFF treatment inhibit autophagy in DA neurons. Differentiated midbrain cells derived from PD patient stem cells were treated with 1 μg/ml of Pam3CSK4 and/or 1 μg/ml α-syn PFFs, or medium only for the untreated control, for 7 and 14 days. a Cells were fixed at day 7 after treatment and stained for autophagy marker P62 (green) and DA neuron marker TH (red). Confocal images were taken at 60 × magnification with 8 images captured per condition and used for the analysis of P62 signal intensity. Scale bar, 10 μm. b Graph shows the fold change in P62 intensity/TH neurons as normalised to the control as mean ± SEM (n = 9). c To assess autophagy flux cells were treated with Bafilomycin A1 for 4 h, fixed and stained for P62 (green) and TH (red). Confocal images taken at 60 × magnification with 8 images captured per condition. Scale bar, 10 μm. d Graph shows autophagy flux measured as P62 expression in Bafilomycin A1 treated/Control treated TH positive neurons, displayed as mean ± SEM (n = 6). e Cells were fixed at day 14 after treatment and stained for LAMP2A (green) and TH (red). Confocal images were taken at 60 × magnification with 8 images captured per condition. Only signal in TH positive neurons was measured for final analysis. Scale bar, 10 μm. f Graph shows the LAMP2A integrated density measured in TH neurons specifically displayed as mean ± SEM (n = 3). *P < 0.05, ns = not significant

