Fig. 8.
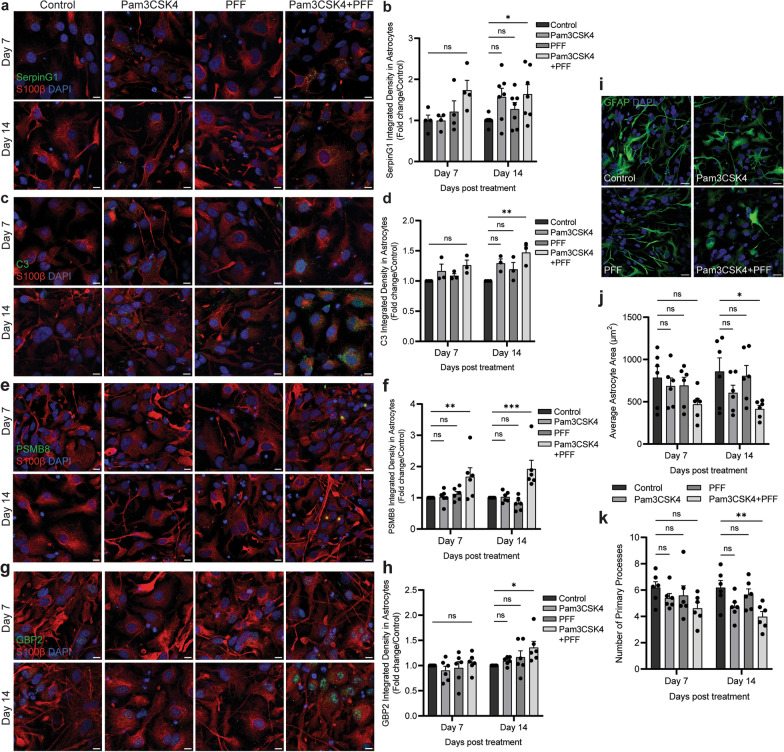
Co-treatment with Pam3CSK4 plus α-syn PFF increases A1 astrocytes. iPSCs derived from PD patients were differentiated into a midbrain model and treated with 1 μg/ml Pam3CSK4 and/or 1 μg/ml PFFs, or medium only for the untreated control for 7 and 14 days. a–h Cells were fixed at the indicated timepoints after treatment and stained for A1 markers: complement cascade regulator SerpinG1, complement component 3 (C3), PSMB8, or GBP2 (all in green) and astrocyte marker S100β (red). Confocal images were taken at 40 × magnification with 6–8 images captured per condition and used for signal analysis in astrocytes. Scale bar, 10 μm. Graphs show the expression of A1 markers measured in S100β positive astrocytes expressed as fold change/control, displayed as mean ± SEM (n = 3–7). i cells were fixed at the indicated timepoints after treatment and stained for astrocyte marker GFAP (green). Confocal images were taken at 40 × magnification with 6 images captured per condition. Scale bar, 20 μm. j graph shows average astrocyte area (μm2) as mean ± SEM (n = 6). k graph shows number of primary processes extending from astrocyte soma displayed as mean ± SEM (n = 6). For all graphs *P < 0.05, **P < 0.01, ***P < 0.001, ns = not significant

