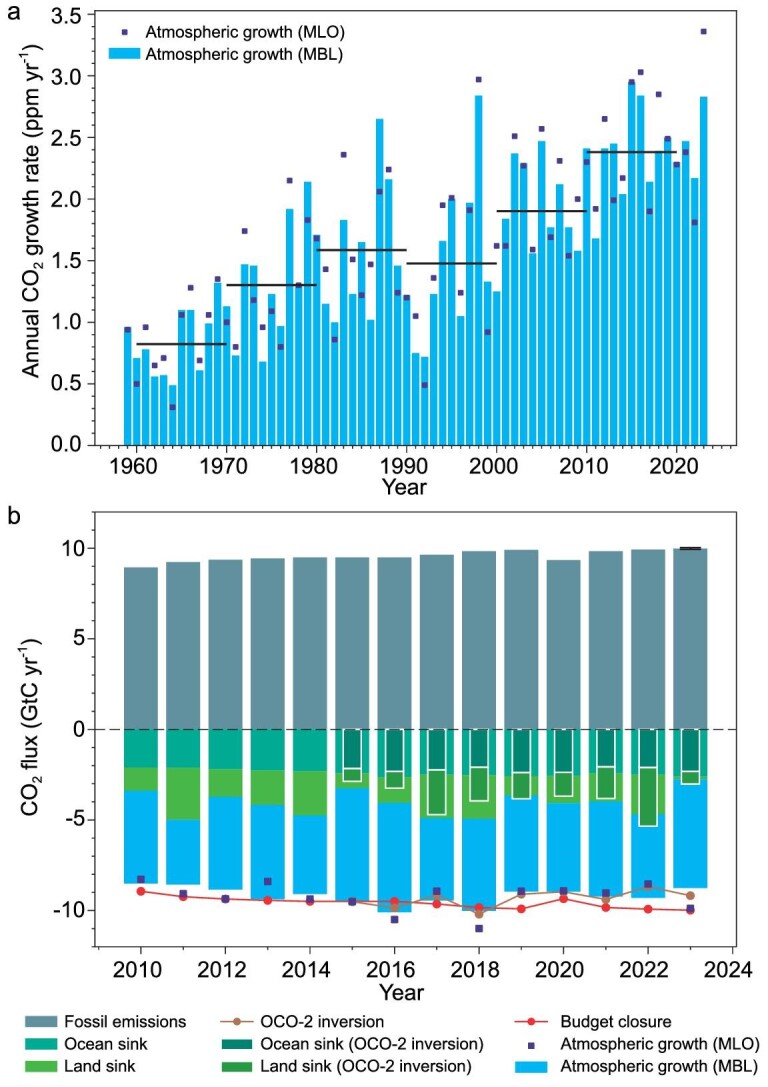
Figure 1.

Atmospheric CO2 growth rate from 1960 to 2023 and carbon budget from 2010 to 2023. (a) Growth rate from marine boundary layer surface stations (MBL, blue bars) and the Mauna Loa station (MLO, dark blue squares). (b) Global CO2 budget obtained with historical fossil fuel and cement CO2 emissions, and our estimates of land and ocean sinks in 2023, and the MBL/MLO CO2 annual growth rates. Our estimates are based on simulations by emulators of the ocean sink and simulations of the land sink by three dynamic vegetation models forced by low latency climate input data (their mean sink in 2019–2022 being adjusted to equal the median of 16 models used in the latest Global Carbon Budget edition). The ocean and land sinks in the inside bars are from the OCO-2 high-resolution atmospheric inversion. The difference between the stacked bars at the bottom and the red curve (–1 × fossil emissions) is the imbalance of the budget.
